

EURJPY TRADE SETUP
How to see the Trade possibility ?
1. Trend -
Identification of the Trend - "UP or DOWN"
Price is making Higher Highs and Higher Lows -
Trend is "UP"
Price is making Lower Highs and Lower Lows -
Trend is "Down"
Now you have 2 possibilities -
(I) Contra Trade (Against The Trend) OR
(II) Ride with the Trend
2. Trendline/Channel Formation - Making Trend Lines.
Whether Price is Moving in a Channel?
3. Support & Resistance
Check whether Price is taking support at previous
resistance or taking resistance at Previous Support.
Trendline Support & Resistance of Channel.
You can use Fibonacci Ratios too.
4. Candlestick Pattern
Now Check at Support & Resistance which Candlestick
Pattern has been made so that we can take our trade
accordingly.
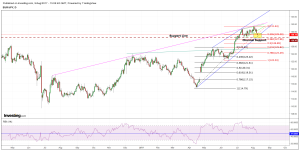
So Here, in EURJPY - Price is in up trend making higher highs and higher lows. Perfectly moving in a Blue Parallel channel and also has a rising wedge Pattern.
So now we have 2 Setups -
Contra Trade - If Trendline Breaks go short, Price can retest previous resistance at 125.50 levels
Ride with trend - Price currently at Channel (Lower Trendline) Support. Wait for some decent green candle to go long.
Earlier also price moved between the Fibonacci 23.6%-38.2% retracement and again price is testing the Fibonacci 23.6%-38.2% levels.
lets see where it will give the entry 


Comments
Log in or sign up to join the conversation.