
| Instrument | IBM |
| Time Frame | DAILY |
| Fundamentals | Price: $134.26 |
| Dividend Yield: 4.8% | |
| Current Dividend Annualized: $6.48 | |
| Normalized Diluted Earnings Per Share (TTM): $8.32 | |
| Earnings Report: 10/17/19 | |
| Next Earnings Report: 1/22/20 | |
| Recommendation | Large Diversified Dividend Portfolios / Should Be Considered |
| Looking For Exposure to Technology Sector / Should Be Considered | |
| Deep Value Investors / Should Be Considered | |
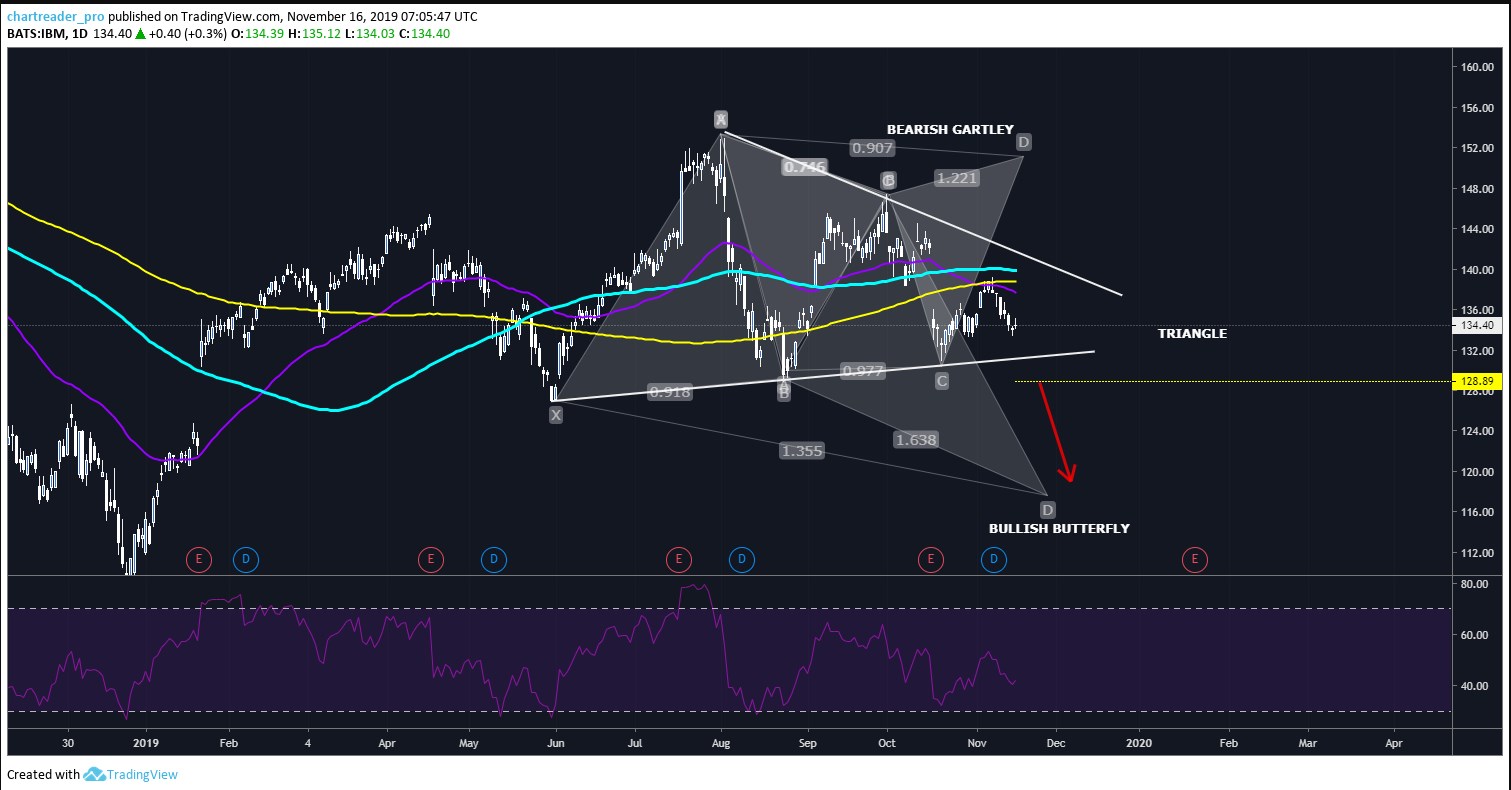
| Technicals | Stock is pricing below EMA50 SMA100 SMA200 Daily |
| Trading in a triangle | |
| Potential Bearish Breakout of the triangle 131.000 | |
| Main Trend | Neutral |
| The direction in The Chart | Down |
| Pattern/ Signal | Triangle Breakout |
| Trade Signal | Sell |
| Accuracy | 64% |
| Estimated Completion Time | 4-9 D1 Chart |
| Entry 1 | 131.000 |
| Entry 2 | |
| Invalidation Level ( Stop Loss) | 134.500 |
| Target 1 | 128.120 |
| Target 2 | 125.00 |
| Target 3 | 121.880 |
| Target 4 | 118.100 |
|
|
Bullish Butterfly Pattern would be completed at 117.500. |
IBM Shows Signs Of Weakness Technically

Stock is pricing below EMA50 SMA100 SMA200 Daily
Disclaimer:
This chart has been published for educational purposes only and cannot be considered as trading advice. This pattern/ analysis prepared by the global analysts of Chartreaderpro.com and published on Talkmarkets.com. Commercial distribution is strictly prohibited.
Disclaimer: This and other personal blog posts are not reviewed, monitored or endorsed by TalkMarkets. The content is solely the view of the author and TalkMarkets is not responsible for the content of this post in any way. Our curated content which is handpicked by our editorial team may be viewed here.

Comments
Log in or sign up to join the conversation.