
<< Read Part I: How Wind Power Caused The Great Texas Blackout of 2021
- Texas has the freest deregulated electric power market in the country and enjoys the lowest electricity rates. While there are rare occasions when this vibrant free-market approach fails to satisfy all consumer demands, and The Great Texas Blackout of 2021 was one of those occasions, many Texans believe a few days of inconvenience are a fair price to pay for decades of cheap electric power.
- Notwithstanding irrefutable published data, national press and media organizations are uniformly spreading a fairy tale that dismisses wind power’s contribution to The Great Texas Blackout of 2021 and lays blame at the feet of gas-fired power producers.
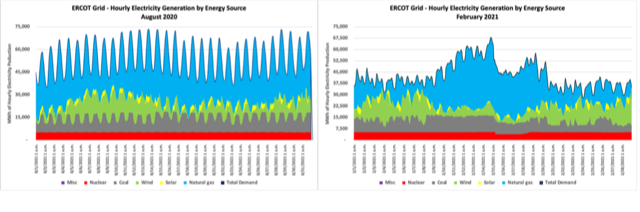
- According to hourly electricity generation by energy source data published by the US Energy Information Administration:
- Wind power production fell from 9 GW at 6:00 pm on February 14th to 5.5 GW at midnight;
- Natural gas-fired power production ramped from 41 GW at 6:00 pm on February 14th to 44 GW by 9:00 pm, followed by a slow decline to 40.5 GW by 2:00 am on the February 15th;
- Wind power production collapsed from 5.5 GW at midnight on February 14th to 649 MW at 8:00 pm on February 15th;
- Natural gas-fired power production spiked down from 40.5 GW at 2:00 am on February 15th to 33.1 GW at 3:00 am as rapidly falling wind power and rapidly rising consumer demand set off a cascade of failures that took a third of the State’s gas-fired plants offline.
- Coal-fired power production fell from 11.1 GW to 7.7 GW between 2:00 am on February 15th and 3:00 pm as declining wind power production and rising demand tripped automated safety systems.
- Nuclear power production fell from 5.1 GW at 5:00 am on February 15th to 3.8 GW at 7:00 am as declining wind power production and rising demand tripped automated safety systems.
- The result was a widespread power grid failure that left 1 in 3 customers without electricity for a few days. Now that temperatures have moderated and things are back to normal, The Great Texas Blackout of 2021 is little more than an unpleasant memory, coupled with a fabulous opportunity to learn from extraordinary circumstances.
Last Thursday, I published an article titled “How Wind Power Caused The Great Texas Blackout of 2021” If you haven’t read that article, you should probably do so because it contains much of the foundation for this piece. Since many national press and media organizations are spreading a fairy tale that lays blame at the feet of gas-fired power producers and this article challenges their journalistic integrity, I’ve created an Excel workbook that starts with the hourly data that I downloaded from the US Energy Information Administration and adds two spreadsheets with my analysis. You can download a complete copy of my Excel workbook by clicking this link.
Examples of wildly inaccurate stories from national press and media organizations include:
|
NPR |
No, The Power Crisis in Texas Wasn’t Caused by Renewables. Here’s What Really Happened. |
|
AP News |
|
|
Bloomberg |
Blame Texas Exceptionalism For This Crisis, Not Green Energy |
|
NY Times |
No, frozen wind turbines aren’t the main cause of the Texas blackouts. |
|
Wall Street Journal |
The stories are unadulterated balderdash! While I would like to attribute the journalistic short-comings to inept research, my inner libertarian suspects ideology-driven spin or propaganda.
Texas has the freest deregulated electric power market in the country and enjoys the lowest electricity rates. At any given time of the day or night, a power generator with electricity to sell can jump into ERCOT’s Real-Time Market with an offered price. If his offered price is lower than other power producers, he’ll win the auction and sell his power before higher-priced competitors sell theirs. While the Real-time Market works well, it gives wind power producers a leg-up because (a) they have a very low marginal cost of producing electricity, and (b) they’re entitled to Federal production tax credits, or “PTCs,” that typically exceed the marginal cost of producing electricity. Many wind power producers can give their power away and end up with positive cash flow because of the PTCs. Therefore, the unwritten rule in Texas is that wind power always enjoys priority over nuclear, coal, and natural gas.
In its Final Seasonal Assessment of Resource Adequacy for Winter 2020/2021, ERCOT said:
“The peak demand forecast for winter 2020-21 was developed using Moody’s economic data obtained in April 2020. The winter SARA includes a 57,699 MW winter peak demand forecast, which is based on normal weather conditions during peak periods, from 2004 through 2018. ERCOT’s all-time winter peak demand record was set on January 17th, 2018, when demand reached 65,915 MW between 7 and 8 am.
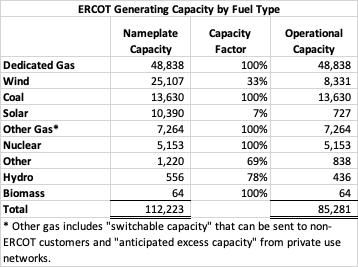
Nearly 83,000 MW of resource capacity is expected to be available for the winter peak, including 963 MW of planned winter-rated resource capacity consisting of wind and utility-scale solar projects.”
By 6:00 pm on Valentine’s Day, power demand in ERCOT had climbed to 66,450 MW, 115% of the forecast winter peak and 101% of the all-time record, and was rapidly rising due to an oncoming winter storm. The scary part was that wind power production was an enormous 9,015 MW or 936% of the forecast winter capacity. While I think it was irresponsible for wind power producers to ramp production to unsustainable in the face of an epic winter storm that was certain to take their poorly winterized turbines offline, participants in free markets have been known to take irresponsible action when faced with a chance to make a quick buck.
When wind power started to fail at 6:00 pm on Valentine’s day, the State’s gas-fired power plants tried to take up the slack and succeeded for a couple of hours. By 8:00 pm on Valentine’s Day, power production in ERCOT had climbed to 68,022 MW, or 118% of the forecast winter peak and 108% of the all-time record, but gas-fired plant operators were unable to simultaneously:
- Fill the supply gap created by rapidly declining wind power production; and
- Fill the demand gap created by consumers fighting the developing storm.
Blackouts were an inevitable and unavoidable outcome. The situation might have resolved differently if wind power hadn’t been such a dominant force at 6:00 pm on Valentine’s day, but I’ll resist the temptation to speculate.
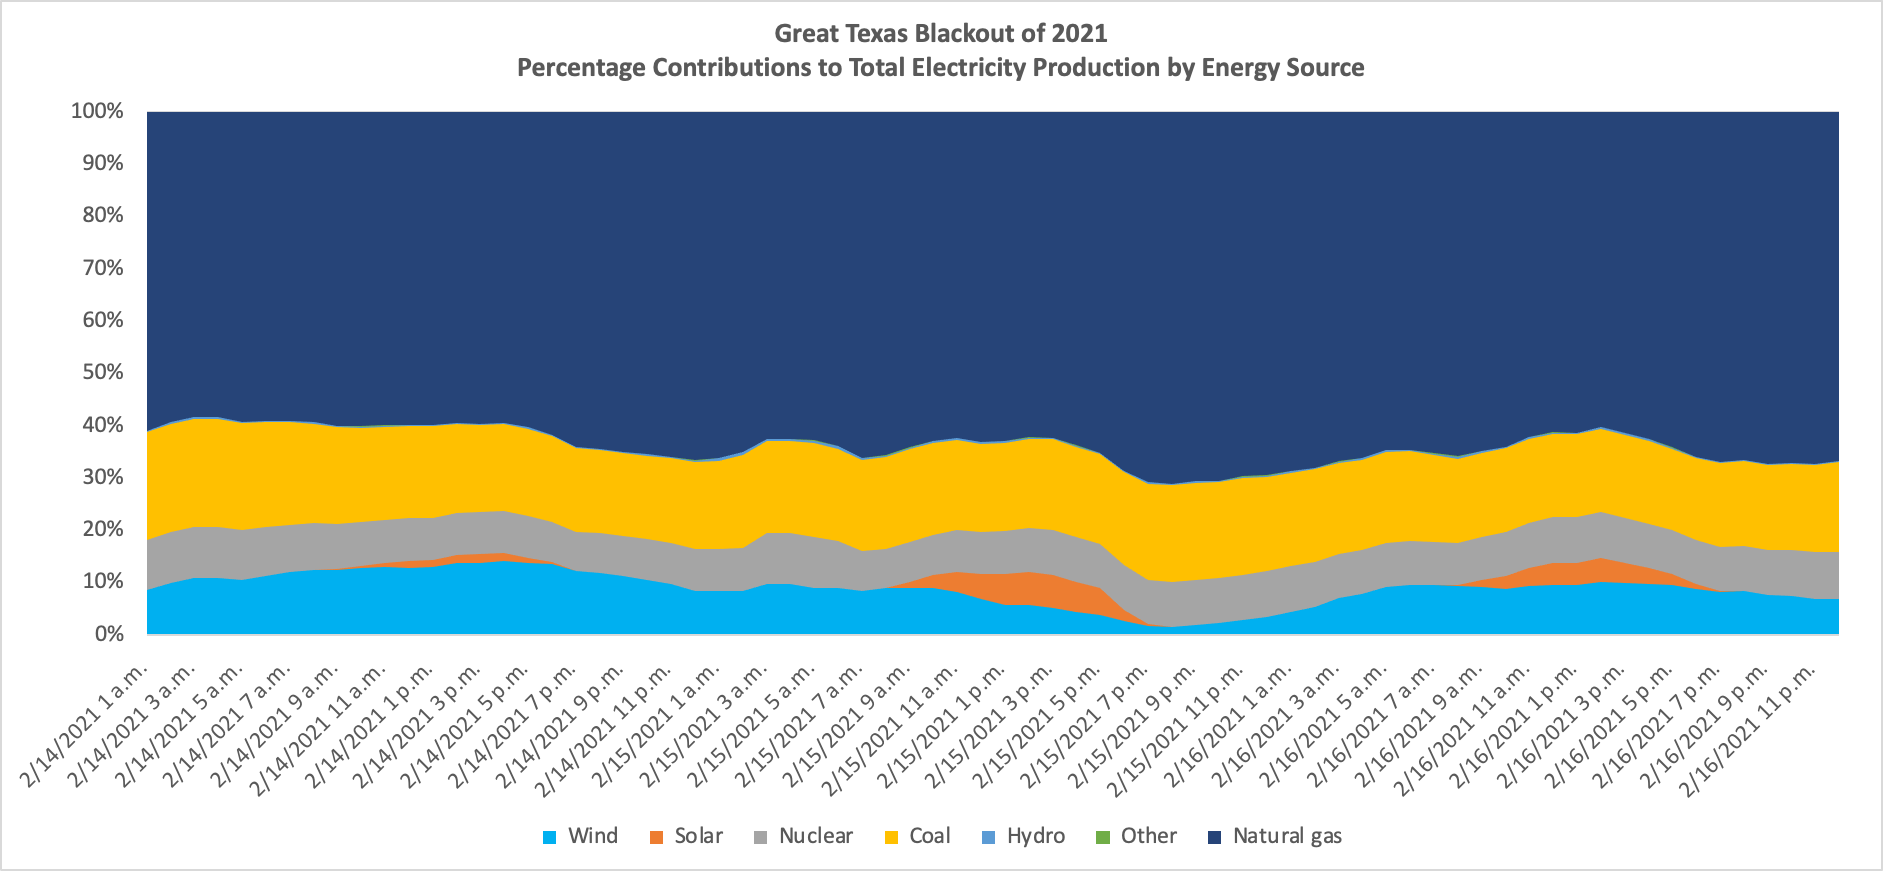
This graph shows the relative contributions of various energy sources to total power production during the blackout. Despite what you hear from national press and media organizations, coal, nuclear, and natural gas all did their fair share of the heavy lifting throughout the blackout. In contrast, wind power went from 14% of total power supplies at 6:00 pm on Valentine’s day to 1% of total power supplies at 8:00 pm on February 15th. Wind power not only failed to deliver when Texans needed it most, it failed spectacularly at the worst possible time.
My second graph presents an alternative view of the percentage contribution data in an unstacked line graph format. The red dotted line represents total electric power production from 6:00 pm on Valentine’s Day to midnight on February 17th. The other lines represent the percentage contributions to total power supplies from all significant ERCOT energy sources.
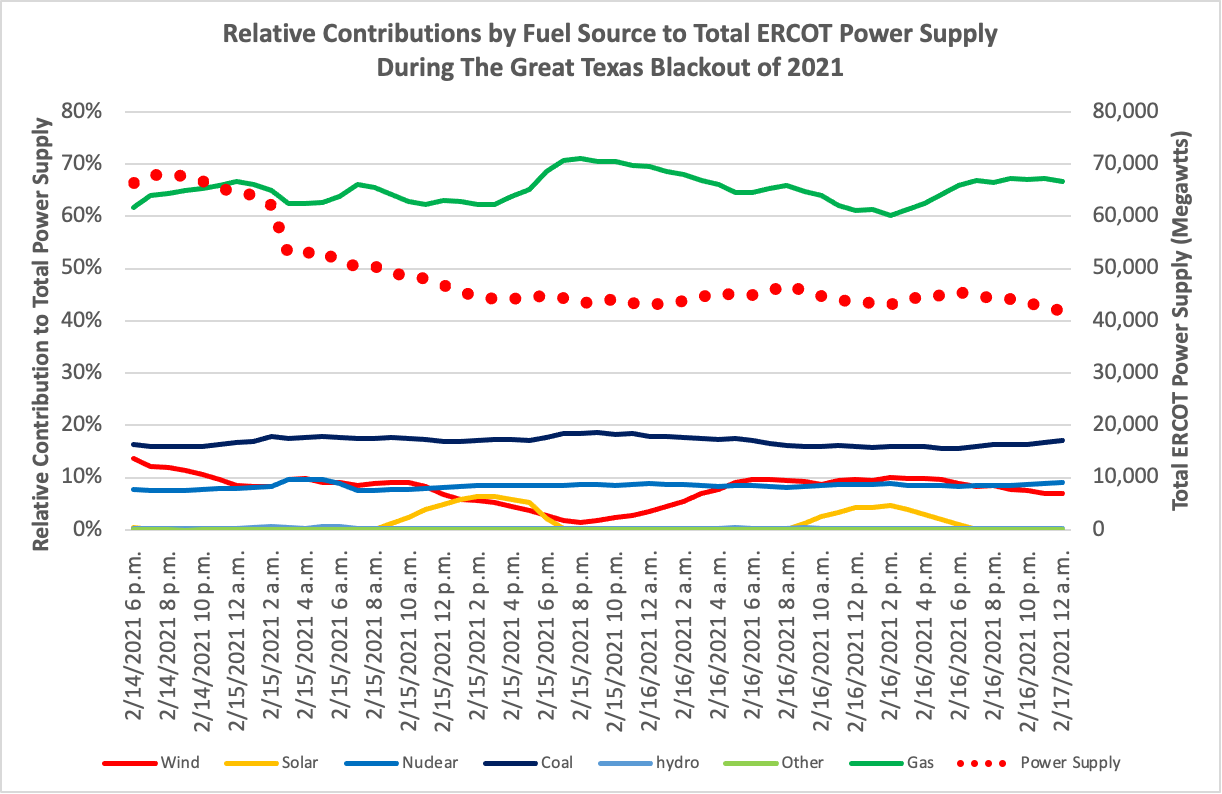
The graph clearly shows that during their worst-performing hours:
- Natural gas power plants produced at least 60.2% of the power available to Texas consumers, or 97% of their relative contribution to power supplies at 6:00 pm on Valentine’s day;
- Coal-fired power plants produced at least 15.6% of the power available to Texas consumers, or 95% of their relative contribution to power supplies at 6:00 pm on Valentine’s day;
- Nuclear power plants produced at least 7.5% of the power available to Texas consumers, or 97% of their relative contribution to power supplies at 6:00 pm on Valentine’s day; and
- Wind power plants produced 1.5% of the power available to Texas consumers, or 11% of their relative contribution to power supplies at 6:00 pm on Valentine’s day; and
- Solar power plants did what solar power plants do and had no meaningful impact.
Now that temperatures have moderated, things are getting back to normal, and The Great Texas Blackout of 2021 is little more than an unpleasant memory. While some Texas consumers are up in arms over blackout-related injuries, the State has rebounded, and many of us believe a few days of inconvenience is a fair price to pay for decades of cheap electric power. I think the inevitable investigations and public hearings will be immensely entertaining. I hope they lead to modest reforms of the free-wheeling ERCOT market that prevent irresponsible action from low-cost but wildly unreliable electricity producers from wind turbines.
Over the last year, wind stocks like Vestas Wind Systems (VWDRY) TPI Composites (TPIC) Northland Power (NPIFF), American Superconductor (AMSC), and NextEra Energy (NEE) have soared on market expectations of unlimited future growth. As formal investigations into the root cause of The Great Texas Blackout of 2021 proceed to an inescapable conclusion that unreliable wind power is not suitable for use in advanced economies without equivalent reliable generating capacity standing by, I think market expectations are likely to turn and turn quickly. I won’t be surprised if the blowback from The Great Texas Blackout of 2021 rapidly bleeds over to other overvalued sectors that rely on renewables as the heart of their raison d’etre, including vehicle electrification.
Comments
Log in or sign up to join the conversation.