

The last time crude dipped as fast and as sharp as it has this year was in the 2008-2009 financial crisis. But, the silver lining in that dip is that investors who bought shares of this ETF that tracks master limited partnerships tripled their investment. Tim Plaehn shows you why now is the best time to buy this ETF that could triple your investment and how to do it without taking on too much risk.
Over the last year, the price of the benchmark West Texas Intermediate –WTI– has dropped by more than half, from over $100 per barrel to around $50 as I write this. This decline in the primary energy commodity price has led to a bona fide bear market in the master limited partnerships –MLPs– sector. The benchmark Alerian MLP Index is down 27% from its August 2014 peak. With plenty of pain going around for MLP investors, a historical review may shed some light on where MLPs can go from here. A couple of charts really tell the story.
From the beginning of 2007 through about the middle of 2008, the WTI crude price went parabolic, climbing from around $60 per barrel up to over $140. However in the second half of 2008, the finance-driven global recession quickly put an end to high energy prices and crude dropped just as fast as it increased, trading in the $30’s by the end of 2008 and into the first quarter of 2009.
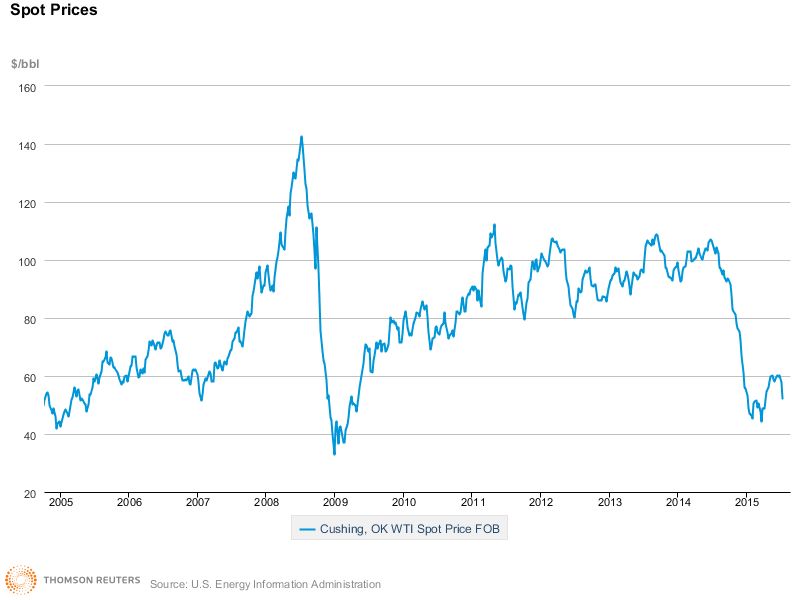
Following a sharp bottom, WTI crude recovered to $80 in the second half of 2009 and then traded in an $80 to $105 per barrel range through the end of October 2014. The current crude price cycle, starting with Thanksgiving 2014 as a chart that now looks a lot like 2008, with weekly average low of $46 in the current cycle.
This next chart is the Alerian MLP Index –AMZ– from its peak in July 2007 through the crude oil crash and until the index surpassed the previous high.
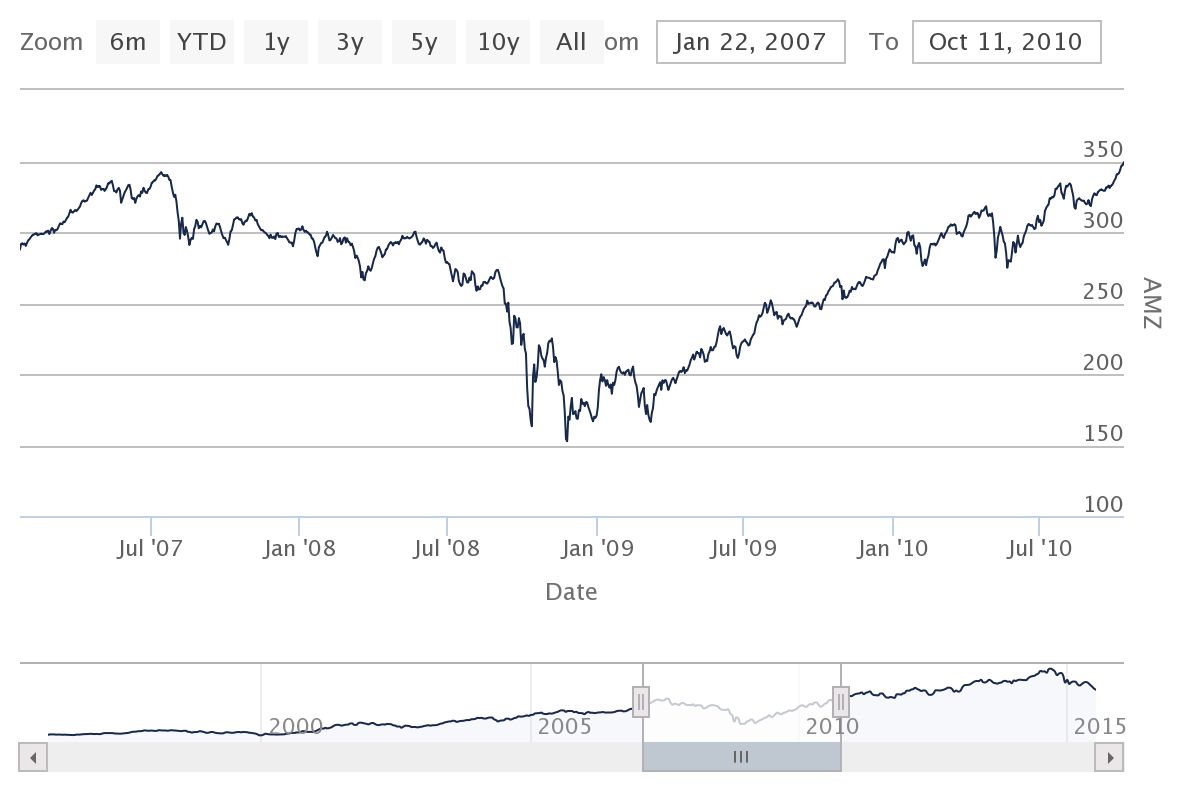
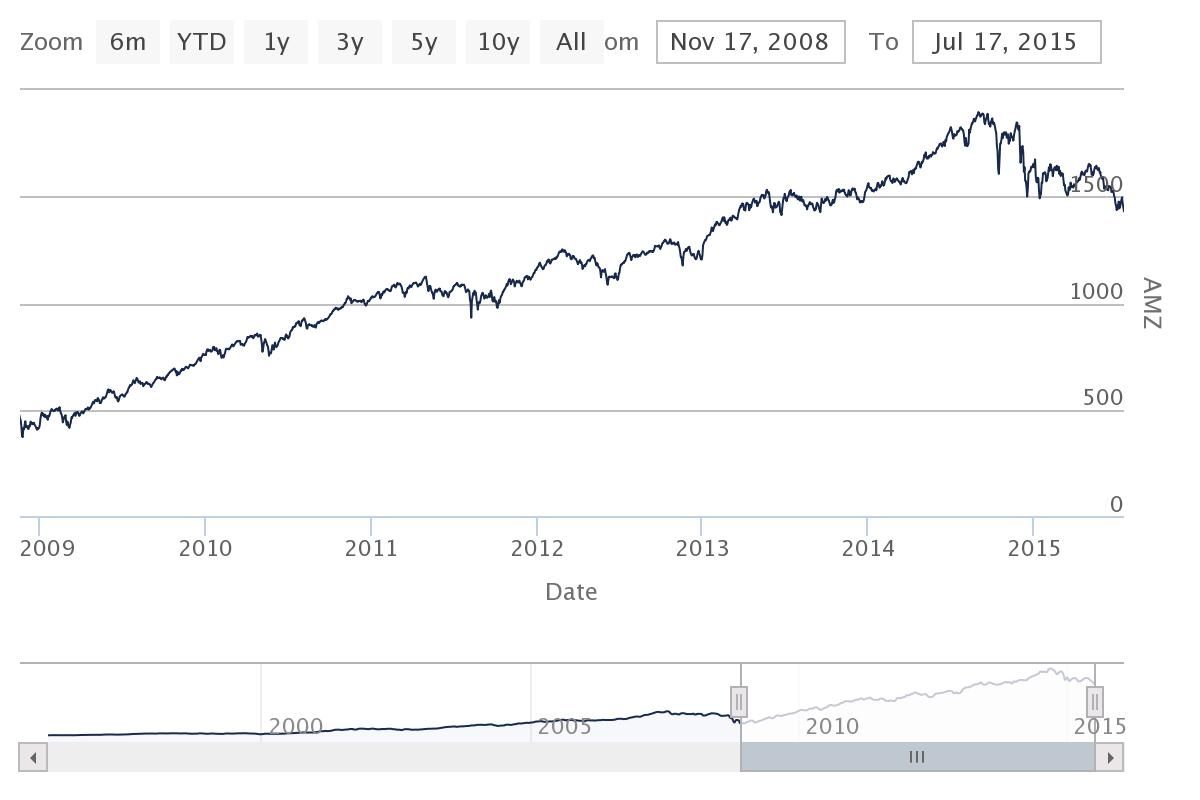
As you can see, the AMZ followed WTI right down, losing 50% of its value by Thanksgiving 2008. As the price of crude recovered and moved higher, the recovery in the AMZ was pretty steady and surpassed the July 2007 peak in early October 2010. A couple of points to consider. Although most of the MLPs tracked by the AMZ provide midstream services, the stable revenue streams and distributions paid by the MLPs did not protect the unit prices. The market sold off everything in the last bear market. As previously noted, the AMZ dropped by half from July 2007 through Thanksgiving week 2008. It then took almost two years for the AMZ to pass the previous high. Recovery was not as fast as the rebound in the price of WTI crude. While crude stabilized into a trading range, the AMZ continued to rise and added another 59% of value until the most recent high in late August 2014. Finally, these numbers do not include the steady 6% to 7% cash distribution MLP investors received during the large price fluctuations in the price of crude oil and the stock market value of MLP units. This chart of the AMZ total return shows that investors tripled their investment value from the late 2008 bottom to the present.
Here are the factors that will lead to a recovery in crude prices, and more importantly MLP values.
- The world needs $100 oil to fund either government budgets and/or oil company capital spending plans. Half price oil will lead to less money spent on production and an eventual decline in total global daily production. I copied this quote out of a recent Wall Street Journal report:
“Oil companies need to replace between 5% and 8% of crude output each year just to offset shrinking production from old wells, analysts estimate. But only six major oil projects worldwide received a go-ahead last year, compared with an average of more than 20 a year from 2002 to 2013, according to Deutsche Bank.”
- Many, if not most MLPs operate in the energy midstream sector where revenues are more stable, and fees from certain services may actually increase with lower energy prices. The larger MLPs can be counted on to continue to grow distributions. Growth rates may slow for a while, but on average investors will receive growing cash income streams from the midstream MLPs.
- The bottom for WTI and AMZ will only be visible in hindsight. Investors with MLPs in their portfolios need to hold on and be happy with growing distributions. To get into the sector, a dollar cost averaging approach may work. Buy some now, buy some more if prices go down another 5%, then again with another 5% drop. Hopefully, we won’t see the second one from here, but bear markets cause a lot of pain before they stop.
How to Play an MLP Recovery
Even some of the best capitalized, fastest growing MLPs are dropping in value. There is not much benefit to try to pick and choose when all MLPs are dropping in the market. At this point the MLP focused ETFs have big tax credits that will help when prices rise. The most widely used ETF index is the Alerian MLP Infrastructure Index –AMZI, which tracks the 25 largest midstream MLPs. The InfraCap MLP ETF (NYSE: AMZA) uses the AMZI components, but is actively managed with different holding weights and some covered call selling for income. At the current time, AMZA yields 11.5% compared to the AMZI index yield 0f 6.35%. The ETF’s dividends have been growing by 1% each quarter. A strategy to dollar cost average into AMZA and reinvest dividend should produce tremendous returns over the next 3 to 5 years.



Comments
Log in or sign up to join the conversation.