

Today, our focus will be on a bearish seasonal window in an interesting and exotic currency pair: the EUR/CHF.
The seasonal bearish pattern developed over the last 24 years, during the time span between February 19 through 27, and gives us a chance to build a strategy to trade the EUR/CHF.
Seasonal Pattern in the EUR/CHF
The key parameter of this seasonal bearish pattern is as follows: between February 19 and February 27, the EUR/CHF saw an average drop of 64 pips for 18 of the past 24 years.
In the remaining six years, it gained on average only 22 pips, while the maximum loss is 32 pips, and the maximum drawdown of 36 pips.
Trade the Seasonal Pattern: EUR/CHF
And now the key question: how could we trade this?
Here's the plan:
- After identifying the profitable seasonal window, sell EURCHF on the closing price of the starting date on February 19 (22:59 CET).
- Identify the maximum loss within the seasonal period. Then, have a look at the daily chart and the ATR(14) indicator.
- If the maximum loss is above the ATR(14) reading, round it up to the next round number and use it as worst-case-stop.
- If the maximum loss is below the ATR(14) reading, use the ATR(14) as your stop-width (rounded up to the next round number).
- Look at the average drop of the seasonal pattern, and place the take profit at this distance from your entry point.
- If the trade is not stopped out or it does not reach its take profit within the seasonal period, end the trade market on the closing price on February 27.
Looking at current market data, since the ATR(14) in the EUR/CHF on a daily time frame is currently trading around 35 pips, and the maximum loss of the window is 32 pips, our worst-case stop will be placed based on the ATR(14), 35 pips away from our entry price.
Meanwhile, the average gain of the seasonal pattern is 64 pips within this period. So, after entering the trade on the closing price of February 19, we would subtract 64 pips to get our take profit level.
(Click on image to enlarge)
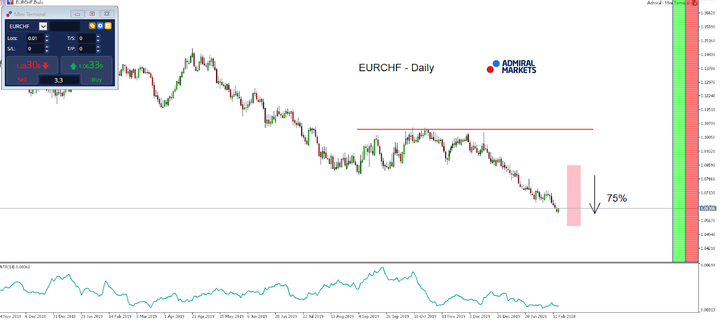
Source: Admiral Markets MT5 with MT5-SE Add-on EUR/CHF Daily chart (between November 14, 2018, to February 14, 2020). Accessed: February 14, 2020, at 09:00pm GMT - Please note: Past performance is not a reliable indicator of future results, or future performance.
In 2015, the value of the EUR/CHF fell by 10.2%, in 2016, it fell by 3.2%, in 2017, it increased by 13.92%, 2018, it fell by 4.4%, 2019, it fell by 3.6%, meaning that after five years, it was down by 9.8%.



Comments
Log in or sign up to join the conversation.