

When analyzing stocks, charts are essential tools that help traders and investors make informed decisions. Understanding how to read these charts can significantly improve your ability to interpret market movements and identify trends. In this article, we’ll explore three common types of stock charts—line charts, bar charts, and candlestick charts—explaining how to read each and which is most commonly used in technical analysis.
1. Line Charts: The Basics of Simplicity
What is a Line Chart?
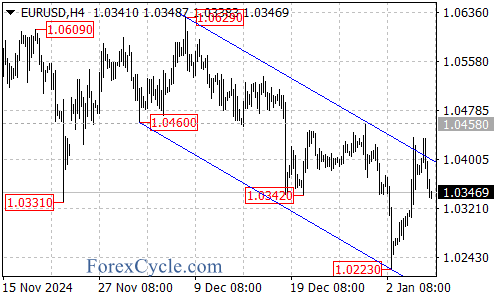
A line chart is the most straightforward type of stock chart. It displays the price of a stock over a specific period, connecting the closing prices of each trading day with a continuous line. This chart type is often used to provide a clear overview of a stock’s price movement over time.
How to Read a Line Chart
- X-Axis (Horizontal): Represents the time period (e.g., days, weeks, months).
- Y-Axis (Vertical): Represents the stock price.
- Line Path: The line shows the stock’s closing prices over the selected period.
Pros of Line Charts
- Easy to read and interpret.
- Ideal for identifying general trends.
Cons of Line Charts
- Lacks detail; only shows closing prices, ignoring the opening, high, and low prices.
Best For:
Line charts are best suited for long-term investors who are more interested in the overall trend rather than daily price fluctuations.
2. Bar Charts: A Closer Look at Daily Movements
What is a Bar Chart?
A bar chart, also known as an OHLC (Open, High, Low, Close) chart, provides more detailed information than a line chart. Each bar represents a single trading period (e.g., a day), showing the opening, high, low, and closing prices.
How to Read a Bar Chart
- Vertical Line: Represents the range between the high and low prices.
- Left Horizontal Line: Indicates the opening price.
- Right Horizontal Line: Indicates the closing price.
Interpreting the Bars
- Long Bar: A long vertical line suggests high volatility during the period.
- Short Bar: Indicates less price movement.
Pros of Bar Charts
- Provides detailed information for each trading period.
- Useful for spotting price trends and volatility.
Cons of Bar Charts
- More complex to read compared to line charts.
Best For:
Bar charts are particularly useful for traders who need to understand daily price movements and market volatility.
3. Candlestick Charts: The Preferred Tool for Technical Analysis
What is a Candlestick Chart?
Candlestick charts are similar to bar charts but provide a more visually intuitive representation of price movements. Each “candlestick” shows the opening, high, low, and closing prices for the trading period, with the body of the candle representing the range between the opening and closing prices.
How to Read a Candlestick Chart
- Candlestick Body: The rectangular body shows the range between the opening and closing prices.
- Wicks (Shadows): The lines above and below the body represent the high and low prices.
- Color: Typically, green (or white) indicates a price increase (close > open), and red (or black) indicates a price decrease (close < open).
Interpreting Candlesticks
- Long Body: Indicates strong buying or selling pressure.
- Short Body: Suggests consolidation or indecision.
- Doji Candlestick: When the open and close are nearly the same, indicating indecision in the market.
Pros of Candlestick Charts
- Highly visual and easy to interpret.
- Provides comprehensive data on price action within a trading period.
- Useful for identifying patterns (e.g., Doji, Hammer, Engulfing).
Cons of Candlestick Charts
- Can be overwhelming due to the amount of detail.
Best For:
Candlestick charts are the most commonly used type in technical analysis, favored by traders for their ability to reveal market sentiment and potential price reversals.
Which Chart Type is Most Commonly Used for Technical Analysis?
Candlestick charts are the most commonly used type for technical analysis. Their detailed information and visual appeal make them ideal for identifying market trends, patterns, and potential reversal points. Traders rely on candlestick patterns to make decisions about entering or exiting trades, as these patterns often provide clues about future price movements.
Why Candlestick Charts?
- Pattern Recognition: Candlestick charts help traders identify patterns that suggest bullish or bearish trends.
- Market Sentiment: The color and size of the candlesticks give insights into the market’s mood.
- Flexibility: They can be used for short-term and long-term analysis.
Conclusion
Understanding how to read different types of stock charts is essential for anyone looking to succeed in the stock market. While line charts offer simplicity, bar charts provide detailed daily insights, and candlestick charts offer the best of both worlds with their detailed, visual representation of price movements. For forex technical analysis, candlestick charts are the go-to tool, helping traders to decode market behavior and make informed decisions.
By mastering these chart types, you’ll be better equipped to navigate the complexities of stock trading and investing.


Comments
Log in or sign up to join the conversation.