
Investing in companies with superior growth can lead to outstanding returns over the long term. However, picking the best growth stocks is easier said than done, and a good idea without solid implementation can do more harm than good. This is especially true among growth stocks, since these kinds of companies are particularly volatile, and picking the wrong names can produce a lot of damage to your portfolio.
This article is presenting a quantitative strategy that looks for companies with consistently above-average growth rates over different periods and vigorous momentum. The main idea is that growth rates are more sustainable when a company is consistently outgrowing the competition over time. Besides, focusing on stocks with strong momentum helps avoid situations in which the company's prospects are starting to deteriorate.
Backtested return numbers for the strategy are quite impressive, although performance is quite volatile and hard to predict. Importantly, investors should never buy a stock simply because the numbers look good, but rather use a quantitative strategy such as this one as a tool to identify potential candidates for further research.
Screening For Consistent Growth Leaders
Companies producing strong growth can generate massive returns for investors, but growth stocks also trade at relatively high valuations. For this reason, consistency is of the utmost importance when investing in high growth stocks.
If growth rates decelerate more abruptly than is expected, high-growth stocks trading at demanding valuations are vulnerable to the downside. Conversely, companies that can sustain superior growth rates for long periods of time are the ones that can deliver explosive returns for shareholders over the years.
The quantitative system starts with a screener that requires companies to deliver revenue growth rates above 50% of stocks in the industry over 3 different timeframes: The most recent quarter, a trailing twelve-month period, and the past three years.
If the company is consistently outgrowing the competition in multiple timeframes, this is indicating that it has superior fundamental qualities and competitive strengths, such as better technologies, a more innovative management team, or superior brand power.
This requirement for consistent growth does a lot of the heavy lifting in the stock selection process. We begin with a universe of almost 6,000 stocks, and when filtering for liquidity and consistent growth leadership we are left with nearly 1,250 names available for inclusion.
Adding Some Momentum To The Mix
The Stocks on Fire system is an algorithm that ranks stocks in a particular universe based on a combination of two main factors: fundamental momentum and price momentum.
Fundamental momentum evaluates how earnings and sales expectations are evolving for the company. This factor basically measures the percentage increase in sales and earnings expectations for the company in both the current year and next year.
The price performance component in the ranking system measures price changes over the past 4 quarters. This factor is looking for stocks that are consistently outperforming the market over recent time periods.
The main idea behind the Stocks on Fire algorithm is quite simple, the algorithm is looking for stocks with vigorous momentum, both in terms of fundamental expectations and in terms of market price performance.
Looking at the long-term backtested data, there is a direct correlation between the Stocks on Fire ranking and annualized returns. Companies in the top quintile, meaning those with a Stocks on Fire ranking above 80, tend to materially outperform the market.
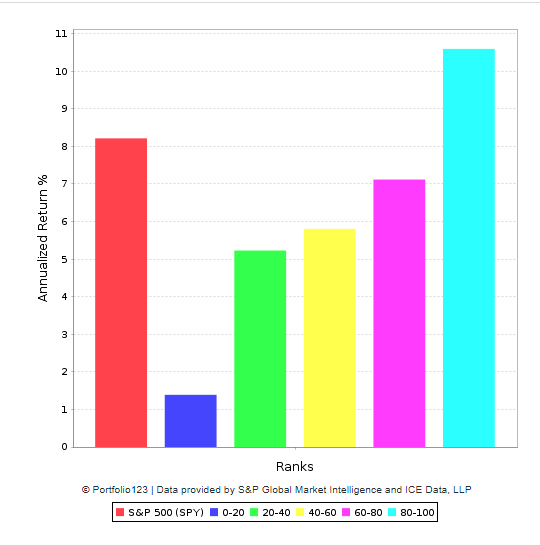
Data from S&P Global via Portfolio123
Among the companies that meet the requirements for consistently above-average growth over different timeframes, the strategy picks the 50 names with the highest score in the Stocks on Fire algorithm.
By combining consistent growth with fundamental momentum and price momentum, the strategy seeks to avoid situations in which the business is slowing down more than anticipated. If you are looking to buy growth stocks, it's better to buy them when they are crushing expectations and outperforming the market.
Backtested Performance
The backtest is based on the following criteria.
- Over the counter stocks, stocks priced below $5, and stocks with a market capitalization value below $250 million are excluded from the investable universe. This is to guarantee a minimum size and liquidity level.
- Companies need to have a revenue growth rate above 50% of companies in the industry over the past three years, the trailing twelve months period, and the past quarter.
- Among the companies that meet the criteria above, the strategy selects the 50 names with the highest ranking based on the Stocks on Fire algorithm.
- The portfolio is rebalanced every four weeks, and trading expenses are assumed to be 0.2% per transaction.
- The benchmark is the iShares Russell 1000 Growth ETF (IWF).
Since January of 1999 the strategy has gained 2,259.42% versus 198.63% for the benchmark. This means that $100,000 invested in the quantitative strategy in 1999 would currently be worth $2.36 million, and the same amount of capital allocated to the Shares Russell 1000 Growth ETF would have a much smaller value of $299,000. System alpha is 11.97% per year.
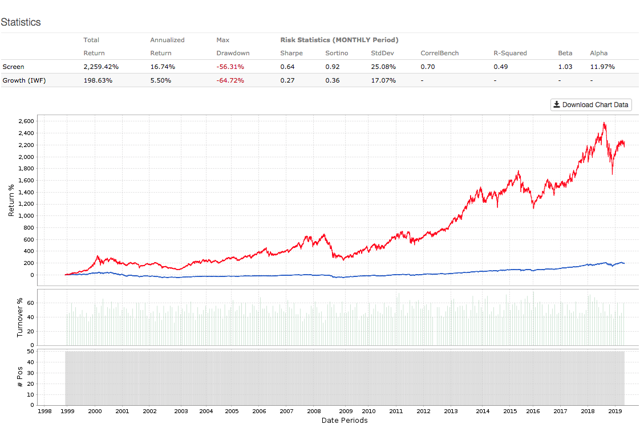
Data from S&P Global via Portfolio123
Practical Considerations And Portfolio
The quantitative strategy outperforms the benchmark by a wide margin in terms of both return and risk-adjusted returns over the long term. However, performance is hard to predict over shorter timeframes. As we can see in the table, the strategy beats the market in the past 20 years and also in the past 3 years, but it underperforms over the past 5 years.
| Strategy | Benchmark | |
| Annualized | 16.74% | 5.50% |
| Three Year | 58.56% | 55.32% |
| Five Year | 64.99% | 78.72% |
| Total | 2259.42% | 198.63% |
| Sharpe Ratio | 0.64 | 0.27 |
| Sortino Ratio | 0.92 | 0.36 |
| Max Drawdown | -56.31% | -64.72% |
| Standard Deviation | 25.08% | 17.07% |
| Correlation | 0.7 | - |
| R-Squared | 0.49 | - |
| Beta | 1.03 | - |
| Alpha (annualized) | 11.97% | - |
This is perfectly natural and even to be expected. No strategy - quantitative or discretionary - can outperform the market in each and every year. The statistical evidence is conclusive, even the most effective strategies and the most renowned asset managers in the world can go through extended periods of underperformance.
Importantly, combining growth and momentum in the same strategy can make it particularly vulnerable to downside volatility. In times of risk aversion in the markets, investors tend to look for safety among stable and predictable companies, so growth leaders with strong momentum fall harder than the averages when risk appetite is declining.
Another important risk consideration to keep in mind is that the strategy does not incorporate any valuation criteria, which can be a major source of risk. Even when a business is growing rapidly and enjoying accelerating momentum, the stock can be a dangerous investment if the valuation is excessively high.
Investors should never buy a stock only because it appears in a quantitative screener. The smart thing to do is using the screener as a powerful source for investment ideas for further research. Among other qualitative factors, it makes sense to evaluate variables such as the company's competitive strength, the quality of its management team, and the long term growth opportunities that the company is facing.
Those considerations being fully acknowledged, the table below shows the 50 names currently picked by the quantitative strategy. Data in the table also includes the Stocks on Fire ranking, sales growth over a trailing twelve months and industry sales growth.
| Ticker | Name | Stocks on Fire | Sales Growth | SalesGrowth Ind |
| AUDC | Audiocodes Ltd | 98.54 | 12.43 | 6.89 |
| CTRE | CareTrust REIT Inc | 99.38 | 12.83 | 6.12 |
| CSL | Carlisle Cos Inc | 98.51 | 15.28 | 3.89 |
| CMG | Chipotle Mexican Grill Inc | 99.42 | 10.29 | 6.75 |
| CPRT | Copart Inc | 99.3 | 12.31 | 6.29 |
| CYBR | CyberArk Software Ltd | 99.97 | 33.85 | 15.43 |
| BOOM | DMC Global Inc | 99.57 | 62.44 | 13.24 |
| EHTH | eHealth Inc | 99.67 | 44.16 | 6.54 |
| ENPH | Enphase Energy Inc | 99.89 | 14.91 | 9.6 |
| EPAM | EPAM Systems Inc | 98.84 | 25.17 | 7.97 |
| ESNT | Essent Group Ltd | 98.72 | 22.07 | 11.04 |
| FSV | FirstService Corp | 98.4 | 12.14 | 1.84 |
| FLDM | Fluidigm Corp | 99.86 | 15.91 | 7 |
| GLOB | Globant SA | 99.22 | 23.48 | 15.43 |
| HRS | Harris Corp | 98.92 | 9.03 | 8.62 |
| HEI | HEICO Corp | 99.71 | 16.8 | 8.62 |
| PI | Impinj Inc | 98.69 | 10.1 | 2.57 |
| KNSL | Kinsale Capital Group Inc | 99.51 | 25.72 | 6.54 |
| KL | Kirkland Lake Gold Ltd | 99.04 | 31.57 | 11.52 |
| KRNT | Kornit Digital Ltd | 99.28 | 26.51 | 9.1 |
| TREE | LendingTree Inc | 99.18 | 27.01 | 11.04 |
| LULU | lululemon athletica inc | 99.6 | 24.13 | 5.42 |
| MELI | MercadoLibre Inc | 99.8 | 25.6 | 13.09 |
| MSCI | MSCI Inc | 98.87 | 9.8 | 6.23 |
| NEO | Neogenomics Inc | 99.48 | 25.44 | 17 |
| NGL | NGL Energy Partners LP | 98.71 | 40.65 | 16.95 |
| NMIH | NMI Holdings Inc | 99.36 | 44.5 | 11.04 |
| NVCR | NovoCure Ltd | 99.13 | 38.6 | 14.44 |
| OSIS | OSI Systems Inc | 98.68 | 10.12 | 7.19 |
| PAYC | Paycom Software Inc | 99.21 | 31 | 15.43 |
| PGR | Progressive Corp (THE) | 99.5 | 21.13 | 6.54 |
| PRO | PROS Holdings Inc | 99.65 | 16.22 | 15.43 |
| RNR | RenaissanceRe Holdings Ltd | 99.27 | 16.01 | 6.54 |
| RGEN | Repligen Corp | 98.83 | 34.96 | 31.8 |
| RNG | RingCentral Inc | 98.46 | 33.79 | 15.43 |
| ROP | Roper Technologies Inc | 98.57 | 11.69 | 3.89 |
| SHOP | Shopify Inc | 98.75 | 55.13 | 7.97 |
| SMPL | Simply Good Foods | 98.6 | 12.25 | 2.38 |
| SBGI | Sinclair Broadcast Group Inc | 99.68 | 16.35 | 5.69 |
| STRA | Strategic Education Inc | 99.24 | 67.44 | 0.63 |
| TNDM | Tandem Diabetes Care Inc | 99.39 | 92.05 | 14.44 |
| TRNO | Terreno Realty Corp | 98.51 | 16.06 | 6.12 |
| TDG | TransDigm Group Inc | 99.59 | 17.12 | 8.62 |
| TPB | Turning Point Brands Inc | 98.81 | 20.83 | 13.83 |
| TWLO | Twilio Inc | 99.45 | 71.09 | 7.97 |
| VEEV | Veeva Systems Inc | 99.91 | 25.48 | 15.97 |
| VCYT | Veracyte Inc | 99.98 | 34.32 | 31.8 |
| VSAT | .IncViaSat | 99.85 | 29.7 | 6.89 |
| WWD | Woodward Inc | 99.31 | 25.09 | 9.1 |
| WK | Workiva Inc | 99.12 | 17.85 | 15.43 |
The numbers alone are not enough to build a complete investment thesis for a stock. It's important to evaluate the business behind those numbers in order to tell if the company is strong enough to sustain superior growth rates and vigorous momentum in the future.
That notwithstanding, a quantitative tool such as this one can add a lot of value to the decision-making process. Information is power, and investment decisions supported by quantified data tend to produce superior performance over the long term.
Statistical research has proven that stocks and ETFs showing certain quantitative attributes tend to outperform the market over the long term. A subscription to The Data Driven Investor provides you access to profitable screeners and live portfolios based on these effective and time-proven return drivers. Forget about opinions and speculation, investing decisions based on cold hard quantitative data can provide you superior returns with lower risk.


Comments
Log in or sign up to join the conversation.