
The technology sector offers abundant opportunities for growth and disruptive innovation. But the industry is very competitive and always changing, so picking the right stocks is of the utmost importance when investing in technology.
Many of the most powerful and renowned companies in the market come from the technology sector. This makes a lot of sense considering that technology provides plenty of opportunities for growth and disruptive innovation. On the other hand, the sector is always changing, and the winner of today can easily turn out to be the loser of tomorrow.
Disruptive innovation is a double-edged sword for investors, it can generate massive gains when investing in the companies that are benefitting from innovation, but it can also produce serious losses when positioned on the wrong side of the main industry trends.
This article is presenting a quantitative strategy focused on stocks with superior profitability in the technology sector. Consistent profitability is a reflection of underlying fundamental strengths at the business level, so the main idea is relying on the numbers to identify high-quality stocks in technology.
Academic research has proven that companies with superior profitability tend to deliver above-average returns over the long term, and the quantitative strategy produces solid backtested performance since 1999.
A strategy such as this one has some important limitations that need to be acknowledged, but it can also be a remarkably effective tool to identify promising candidates for further research based on quantified data as opposed to subjective opinions.
Strategy Design
The quantitative strategy is based on a ranking algorithm, which is different from a screener. A screening system will invest only in companies that meet a specific parameter - for example, the return on equity ratio is above 10% and the operating margin level is over 15%.
A ranking system, on the other hand, ranks companies in a particular universe based on return on equity and operating margin and will invest in the companies with the higher ranking based on a weighted average of those indicators.
The ranking algorithm includes a combination of profitability indicators that measure profitability on sales and profitability on assets. This includes: return on investment (ROI), return on assets (ROA), return on equity (ROE), gross profit margin, operating margin, and free cash flow margin.
The main point is focusing on a wide variety of indicators in order to find the companies with superior profitability metrics across a combination of ratios as opposed to relying on one single profitability indicator.
The strategy then is quite simple, we exclude over the counter stocks and we consider only companies with a market capitalization value above $250 million in the technology sector. This is to guarantee a minimum size and liquidity level for the companies in the portfolio.
Among such a universe, the strategy then picks the 25 stocks with the best rankings based on a combination of profitability indicators. The portfolio is equally weighted and rebalanced monthly, and the benchmark is the Technology Select Sector SPDR ETF (XLK).
The backtest compares performance for the quantitative strategy versus the benchmark since January of 1999, with trading expenses assumed to be 0.2% per transaction.
Backtested Performance
The backtested performance numbers are quite strong; since January of 1999, the strategy gained over 1000% versus 194% for the Technology Select Sector SPDR ETF. In simple terms, a $100,000 investment in the quantitative strategy in January of 1999 would currently be worth $1.1 million, and the same amount of capital invested in the benchmark would have a current market value of $294.000. System Alpha amounts to 7.89% annually.
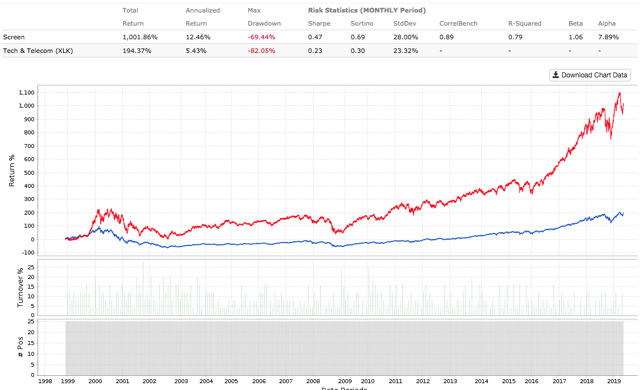
Data from S&P Global via Portfolio123
The table below summarizes return and risk-adjusted statistics for the strategy and the benchmark over different periods. The strategy not only outperforms the benchmark based on returns metrics alone but also when considering risk-adjusted return metrics such as Sharpe and Sortino ratios.
These results need to be interpreted with caution, the backtest outperforms over different timeframes, but this is the exception rather than the rule. Even the strongest quantitative strategies can go through long periods of underperformance from time to time, so investors should never assume that they can expect consistent outperformance year after year from a quantitative strategy or even from a discretionary strategy for that matter.
| Strategy | Benchmark | |
| Annualized | 12.46% | 5.43% |
| Three Year | 102.45% | 83.37% |
| Five Year | 144.39% | 120.70% |
| Total | 1,001.86% | 194.37% |
| Sharpe Ratio | 0.47 | 0.23 |
| Sortino Ratio | 0.69 | 0.30 |
| Max Drawdown | -69.44% | -82.05% |
| Standard Deviation | 28.00% | 23.32% |
| Correlation | 0.89 | - |
| R-Squared | 0.79 | - |
| Beta | 1.06 | - |
| Alpha (annualized) | 7.89% | - |
However, quality investing has proven to work over the long haul, and the data in the table indicates that implementing a high-quality strategy in the technology sector can lead to solid results.
Practical Considerations And Portfolio
The quantitative strategy is based on only one sector - technology - and only one factor - quality. This obviously carries substantial concentration risk, and the idea is not that investors should blindly replicate the strategy in real life but rather use the strategy a source of ideas when looking for high-quality stocks in technology.
The quantitative strategy is based on current data regarding profitability levels for the business in the portfolio. Before making an investment, investors need to check that the company has what it needs in order to sustain performance in the future. If profitability levels are unsustainable for whatever reason, then it doesn't make any sense to invest based on the portfolio recommendations from the strategy.
Another key factor to consider is that the strategy does not incorporate any valuation criteria for the stocks in the portfolio. Companies with superior quality deserve a valuation premium versus the broad market, but when valuations are excessively high, even the best companies can be mediocre investments.
Those limitations being recognized, the table shows the 25 stocks currently picked by the strategy. Data in the table also includes operating margin and return on investment levels for the companies in the portfolio to provide a broad idea about profitability levels for these names.
| Ticker | Name | Operating Margin | ROI |
| ADBE | Adobe Inc. | 29.65 | 22.47 |
| ANSS | ANSYS Inc. | 36.3 | 16.22 |
| ANET | Arista Networks Inc. | 32.61 | 17.58 |
| AZPN | Aspen Technology Inc. | 42.09 | 75.33 |
| CDNS | Cadence Design Systems Inc. | 21.08 | 22.03 |
| CHKP | Check Point Software | 47.2 | 22.22 |
| CSCO | Cisco Systems Inc. | 26.94 | 20.39 |
| CTXS | Citrix Systems Inc. | 21.65 | 22.06 |
| CGNX | Cognex Corp. | 26.74 | 18.85 |
| FFIV | F5 Networks Inc. | 28.65 | 37.31 |
| INTU | Intuit Inc. | 29.58 | 45.29 |
| KLAC | KLA-Tencor Corp. | 35.25 | 27.31 |
| MA | Mastercard Inc. | 56.89 | 52.83 |
| MU | Micron Technology Inc. | 47.11 | 34.77 |
| NTAP | NetApp Inc. | 19.25 | 35.12 |
| NVDA | NVIDIA Corp. | 27.12 | 30.28 |
| PAYX | Paychex Inc. | 37.63 | 37.39 |
| PAYC | Paycom Software Inc. | 30.24 | 35.03 |
| QLYS | Qualys Inc. | 20.37 | 15.7 |
| RHT | Red Hat Inc. | 16.25 | 21.52 |
| TXN | Texas Instruments Inc. | 41.99 | 37.57 |
| UBNT | Ubiquiti Networks Inc. | 34.9 | 44.98 |
| VRSN | Verisign Inc. | 64.01 | 85.98 |
| V | Visa Inc. | 66.81 | 22.65 |
| XLNX | Xilinx Inc. | 31.72 | 22.71 |
Statistical research has proven that stocks and ETFs showing certain quantitative attributes tend to outperform the market over the long term.


Comments
Log in or sign up to join the conversation.