
NEW YORK, NY - OCTOBER 04: Traders work on the floor of the New York Stock Exchange (NYSE) on October 4, 2018, in New York City. With bond prices dropping interest rates have been surging resulting in the Dow Jones Industrials Average falling over 200 points at the close. (Photo by Spencer Platt/Getty Images) GETTY IMAGES
The bond market’s performance got everyone’s attention last week, as the rise in yields made the inversion of the yield curve a few months ago a faint memory. In addition to helping boost the stock market to new highs, it also had a dramatic impact on other markets. But how much higher can yields go over the near term?
To examine this question, we are going to use charts that feature the Moving Average Convergence/Divergence (MACD) Histogram. The MACD-Histogram was created as a way to predict changes in momentum within a market.
2016 TOM ASPRAY- VIPERREPORT.COM
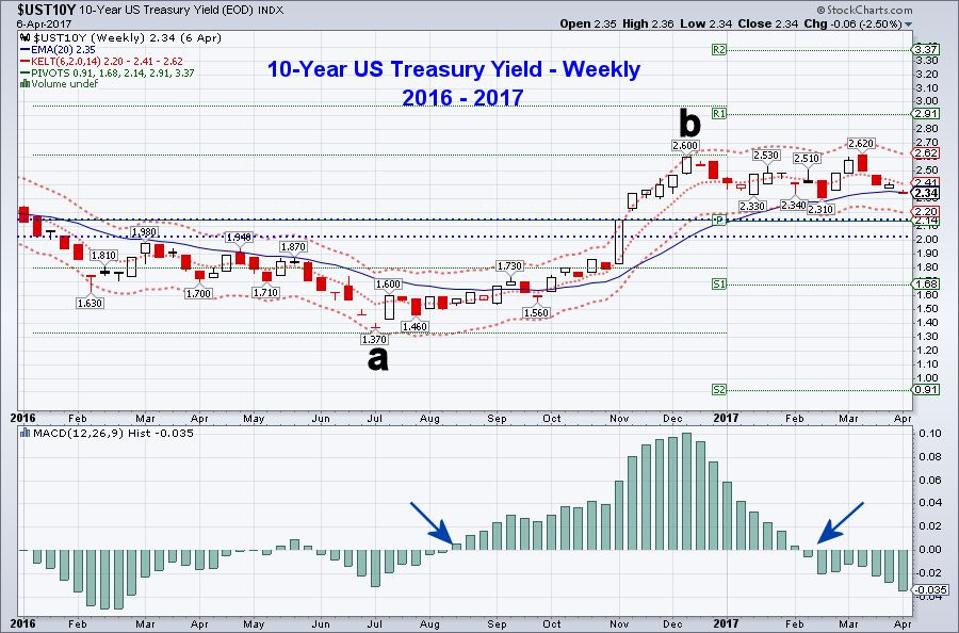
In November 2016, the yield on the 10-Year US Treasury Note rose from 1.81% to a high of 2.60% by the middle of December (point b). In July 2016, the yield had made a low of 1.370% (point a), so the rally was already well underway by the election. The MACD-Histogram turned positive on August 15, indicating a positive trend change, and did not turn back to negative until February 13, 2017.
10Year TOM ASPRAY- VIPERREPORT.COM
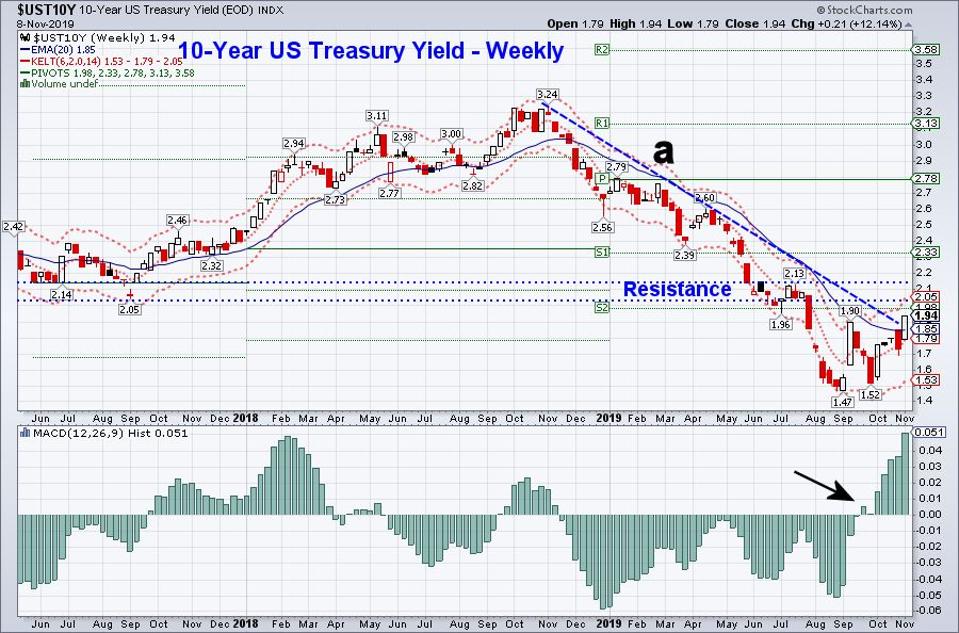
The current chart of the 10-year T-Note shows that last week, the downtrend (line a) from the late 2018 high was overcome, with yields closing last week at 1.94%. There is now chart resistance in the 2.05-2.14% area, which were support levels from the lows in late 2017. It's important to remember that, once a support level is broken, it then becomes resistance. The MACD-Histogram turned positive on September 23, dropped back below the zero level the next week, but has been strong ever since.
30Year TOM ASPRAY- VIPERREPORT.COM
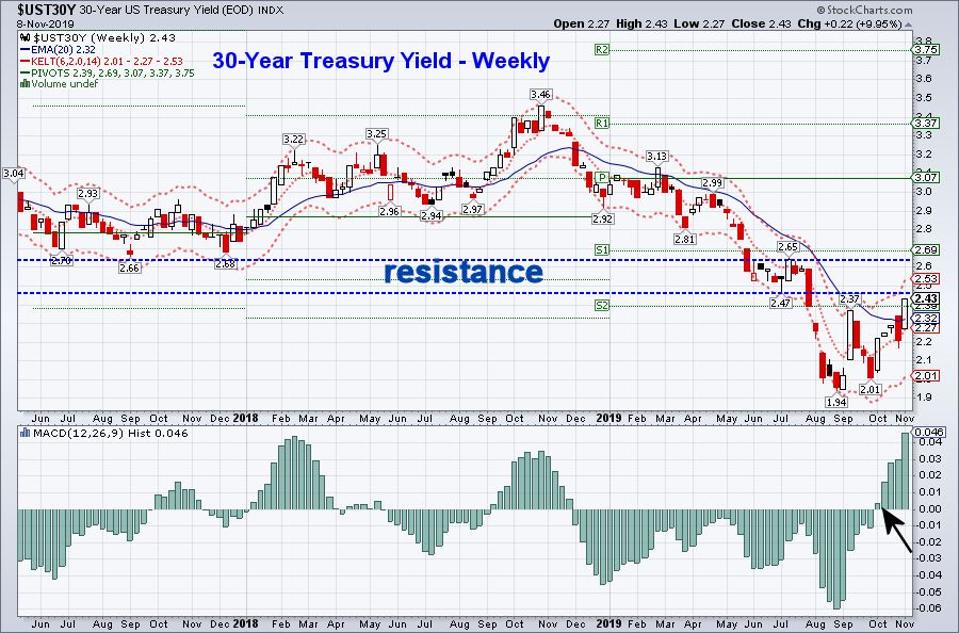
The 30-Year Treasury Yields have also had a dramatic move in the past few weeks, rising from a low of 2.01% to close last week at 2.43%. The July low in yields at 2.47% now represents first resistance that extends to the 2.65-2.70% area, a band of resistance which goes back to the summer of 2017. The weekly MACD-Histogram turned positive on October 7 and has continued to make higher highs.
QQQ TOM ASPRAY- VIPERREPORT.COM
For months, there have been recessionary fears lurking from the inversion of the yield curve in August 2019. But the recent reversal in yields has been great for stocks, driving the market even higher.
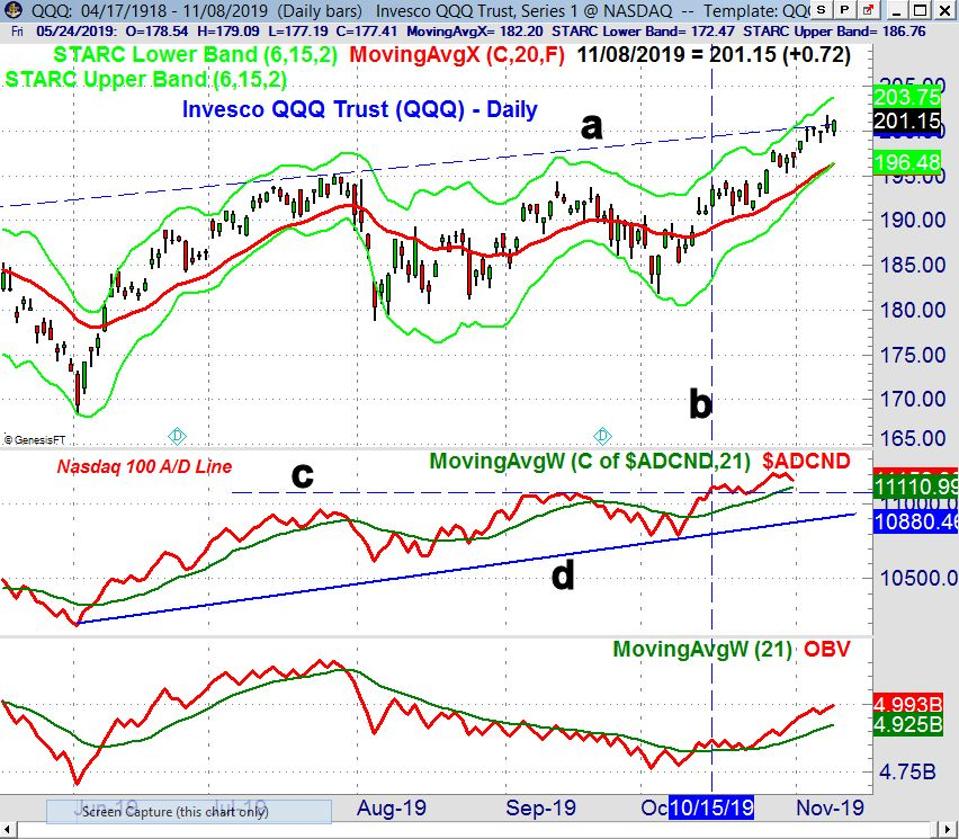
The Invesco QQQ Trust (QQQ), which tracks the Nasdaq 100, added another 1.19% last week, with a Thursday high of $201.77. The resistance that connects the late April and July highs (line a) was reached. There is monthly pivot resistance at $202.98 with the daily starc+ band at $203.75. The rising 20-day EMA at $196.40 now represents first good support and is 2.4% below Friday’s close.
The Nasdaq 100 Advance/Decline line has made a series of new highs since early in the year. The September high (line c) was overcome on October 15 (line b). The A/D line has first support at its rising WMA with more important at line d. The daily On Balance Volume (OBV) has been above its WMA since the early part of October and improved further last week.
The higher yields have helped to boost the U.S. Dollar, as the Invesco DB US Dollar Index Bullish Fund (UUP) rose 1.2% last week, while the Spyder Gold Trust (GLD) was down 3.63%.
After the impressive action of the past few weeks, the major market averages are likely to consolidate or even correct in the next few weeks. Though healthcare has not been a leading sector so far in 2019, I think it does present some opportunities, as I discussed at the end of last week.
There are a number of stocks that have survived earnings but have not yet rallied with the market. They should provide the best opportunities as we head into the end of the year.


Comments
Log in or sign up to join the conversation.