
The vote is in, Joe Biden has won the 2020 US presidential election. Joe Biden's victory and the uncertainty created by the response of the current president Donald Trump could lead to short term market volatility which could, in turn, affect equity prices.

In this article, we will look at the possible impact of these elections on the S&P 500, the EUR/USD currency pair, gold and Brent crude oil prices.
S&P 500
The S&P 500 (SPX) could show increased volatility in the short term after the US elections.
The daily (D1) S&P 500 chart below shows:
- Increasing strength on bullish impulse cycles and decreasing strength on downward moves, supporting the possible scenario of further upward movement.
- Short and medium targets are at 3590 if price can break above the upper band of the recently formed consolidation pattern, marked by the red lines.
Another key level is found at the 3220 price point which has acted as a strong level of support, coinciding with the 200 period exponential moving average and the 38.2% Fibonacci level as measured from the peak of the previous bullish trend.

Source: Admiral Markets MT5, S&P 500, Daily chart. Data range: June 10, 2020, to November 6, 2020. Accessed: November 7, 2020, at 10:00 PM CET. Please note: Past performance is not a reliable indicator of future results, or future performance.
EUR/USD
The recent bullish sentiment of the US dollar could continue after Joe Biden's victory. While this could be good for the US economy in the short term, the long term impact on profits could be negative, taking into account that the US is one of the largest exporters of raw materials. A strong currency would diminish profit margins.
The referenced chart below shows the recent evolution of the EUR/USD currency pair. Recently, a clear consolidation pattern has formed where price moves between the 1.1900 resistance level and the 1.1600 support zone which coincides with the 50% Fibonacci level.
At present, EUR/USD is trading at the top of the consolidation pattern yet short term dollar strength can lead to an overbought condition. While EUR/USD closing above 1.1880 last Friday gave investors hope, all stands and falls with what happens next week. (FXE)
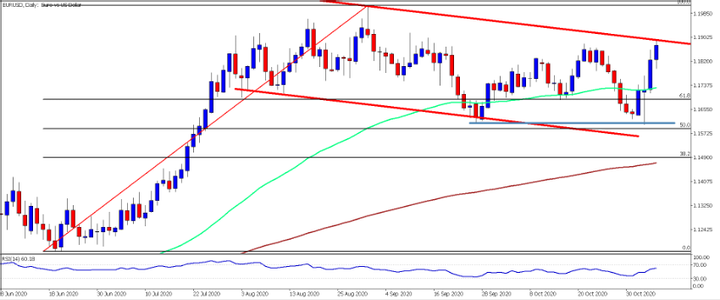
Source: Admiral Markets MT5, EUR/USD, Daily chart. Data range: June 8, 2020 to November 6, 2020. Accessed: November 7, 2020, at 10:00 PM CET. Please note: Past performance is not a reliable indicator of future results, or future performance.
GOLD
Gold prices have been moving in a trading range since early August. Most recently, the gold price has shown a slight upward movement after forming a double bottom pattern at the 1860 price level (coinciding with the 50% Fibonacci level) (GLD).
As price approached this level, buyers seemed to have entered the market. This was reflected by a significant increase in strength on the move higher, which could potentially support further bullishness in the short and medium term.
Gold is a safe haven asset for investors. If market volatility increases, gold is well positioned to potentially benefit.
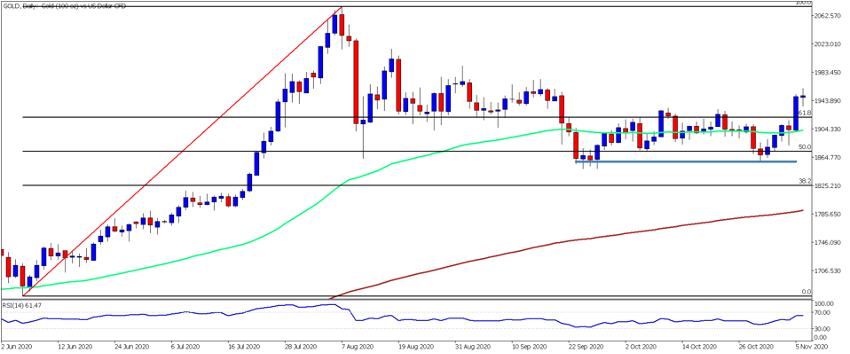
Source: Admiral Markets MT5, Gold, Daily chart. Data range: June 2, 2020 to November 6, 2020. Accessed: November 7, 2020, at 10:00 PM CET. Please note: Past performance is not a reliable indicator of future results, or future performance.
Brent Crude Oil
Brent crude oil prices (BNO) have continued their downward spiral despite positive macroeconomic indicators over recent weeks. Oil prices have been falling as a result of the downward pressure caused by the uncertainty surrounding oil prices in the past months. Expectations are that the uncertainty caused by a new president will further impact oil prices in the short term.
While prices continue to move in a strong bearish trend, the RSI indicator shows an upward movement. This divergence could be indicative of a change in trend.
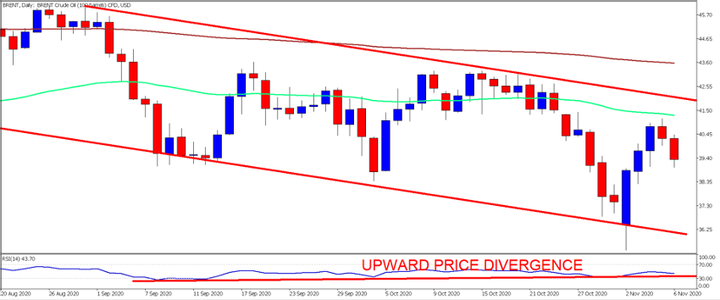
Source: Admiral Markets MT5, BRENT Crude Oil CFDs, Daily chart. Data range: August 21, 2020 to November 6, 2020. Accessed: November 7, 2020, at 10:00 PM CET. Please note: Past performance is not a reliable indicator of future results, or future performance.


Comments
Log in or sign up to join the conversation.