
Understanding how bonds work, from the types and risks to how yields get set, shows why owning them is about far more than the daily price change.
Key Takeaways
A bond is a contract. If you hold an individual bond to maturity and the issuer pays, the price swings along the way never change what you get back.
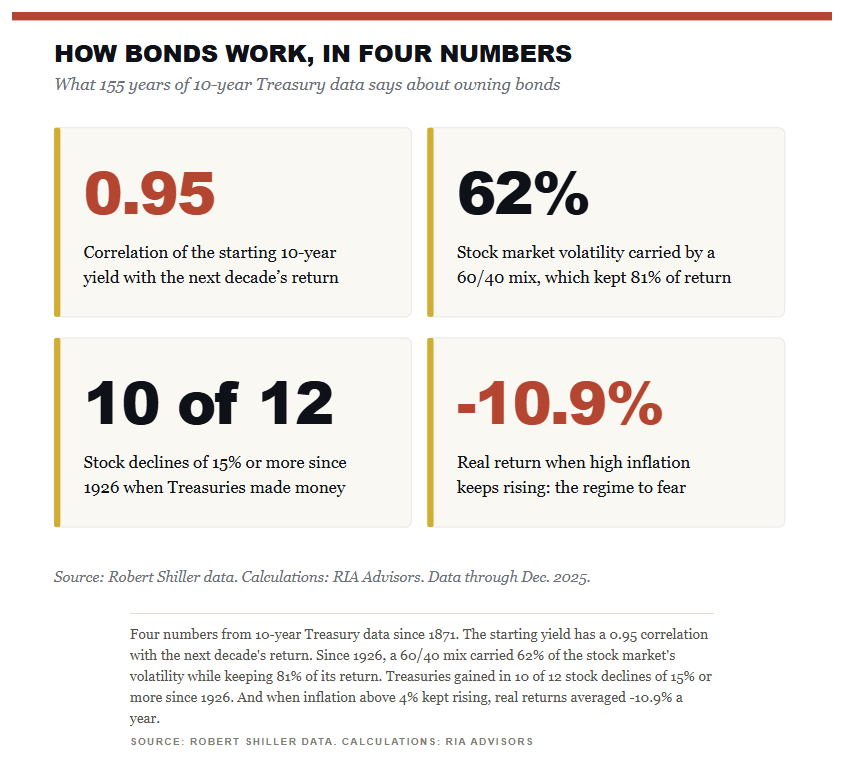
Since 1871, the starting 10-year Treasury yield has had a 0.95 correlation with the bond’s return over the following decade, and no rolling 10-year period has lost money in nominal terms.
Bonds lower portfolio volatility. Since 1926, a 60/40 mix has captured about 81% of the stock market’s returns while absorbing about 62% of its volatility.
The real enemy of bonds is inflation that is already high and still rising. In that regime, real returns averaged -10.9% a year.
Treasuries gained in 10 of the 12 stock declines of 15% or more since 1926. Both exceptions, 1968 to 1970 and 2022, were accompanied by rising inflation.
Every few years, the financial media decides that bonds are “broken.” The headline usually follows a stretch where bond prices fell alongside stocks, and the conclusion is always the same: why own something that loses money when it is supposed to be “safe”?
Here’s the problem with that argument. It judges a bond by the one number that matters least to its owner. Understanding how bonds work starts with a simple idea that most investors have never been taught. The price on your statement is a running estimate of what someone else would pay you today. It is NOT the amount the issuer has promised to pay you.
While that distinction may sound academic, wait until you watch what it does to investor behavior. For years, bond fund prices only went higher. However, the last 5 years have caused some pain for individuals, and with bond funds down 12%, their first inclination is to sell.
Of course, this is usually the point where investors sell near the low, then swear off bonds for a decade. People who understand the contract they own tend to do the opposite. This article is the long version of that conversation: what bonds are, the types you’ll run into, the risks that actually matter, how yields get set, and why the job bonds do in a portfolio has very little to do with the daily print.
How Bonds Work: A Contract, Not A Stock Quote
It’s hard to understand how bonds work, when no one really explains them. Once you strip away the jargon, a bond is just a loan you make to a government or a company. That’s it. Nothing more. The borrower agrees in writing to pay a fixed interest rate (the coupon) on a set schedule. It also agrees to return your principal, the par or face value, on a specific date called the maturity.
That’s the whole deal. A simple contract.
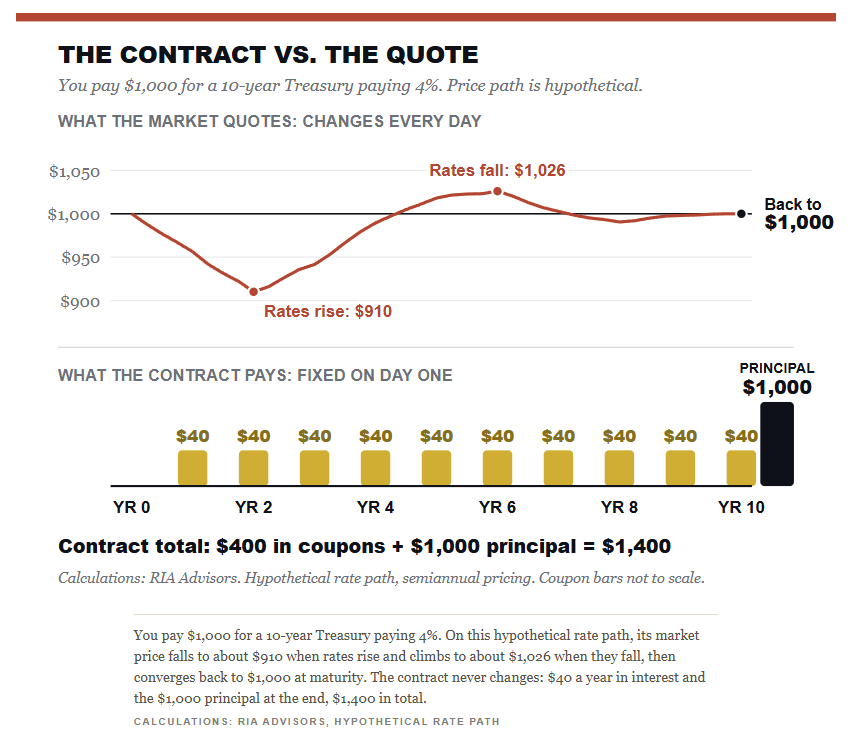
Everything else you’ll hear about bonds, from duration and convexity to spreads and the yield curve, is a way of describing what happens to the value of that promise between the day you buy it and the day it ends. A 10-year Treasury with a 4% coupon pays $40 a year per $1,000 bond, in two $20 installments. At the end of year ten, it hands back the $1,000.
A stock makes none of those promises. There is no maturity date, no contractual payment, and no guarantee you ever get your money back. This is why the two assets behave so differently over time, even when they move together for a few weeks. With a stock, the market price is the only exit. With a bond held to maturity, the market price is one of two exits. The other is written into the contract.
Think of it like owning a rental house with a signed ten-year lease. If rents in the neighborhood jump, the market value of your house (with its below-market lease attached) falls, because a buyer would rather collect today’s higher rents. Your tenant, however, keeps paying exactly what the lease says. When the lease ends, you get the house back and can rent it at the going rate. A bond’s market price is the appraisal of the lease, not the lease itself. Investors who confuse the two make most of the mistakes that cost them money in fixed income.
The Seesaw Between Price And Yield
Let’s start with the inverse relationship between bond price and the yield. When a bond is issued, its coupon is fixed for life. The only thing that changes is the yield that new buyers demand. Let me explain.
Let’s assume you have a bond with a 4% interest rate. However, the current going interest rate on a new bond of similar credit quality and duration is 5%. If you try to sell your 4% coupon bond today, the bond’s price must decline so that the “yield to maturity” equals 5%. In other words, the buyer of your 4% bond will pay less than face value of the bond today, so that when it matures at “par” in the future, the combined return of the coupon payments and the capital gain in the bond equates to a 5% rate of return.
Of course, when rates fall, the reverse happens: your older, higher-coupon bond becomes worth more than par. That inverse relationship is the seesaw every bond investor rides.
The number that captures this is the yield to maturity. It’s the annualized return you lock in by buying at today’s price and holding to the end. That assumes you collect every coupon, reinvest each one at the same rate, and get par back. In other words, the yield to maturity is the market’s price tag stated as a return. That’s why bond traders quote yields instead of prices.
How far the price moves depends mostly on time. A bond that matures in two years doesn’t have much room to be “wrong” about rates. A 30-year bond does. The measure of that sensitivity is “duration,” which is roughly the percentage price change for a one-point move in yields. The chart below shows the math for a 4% Treasury when its yield rises from 4% to 5%.
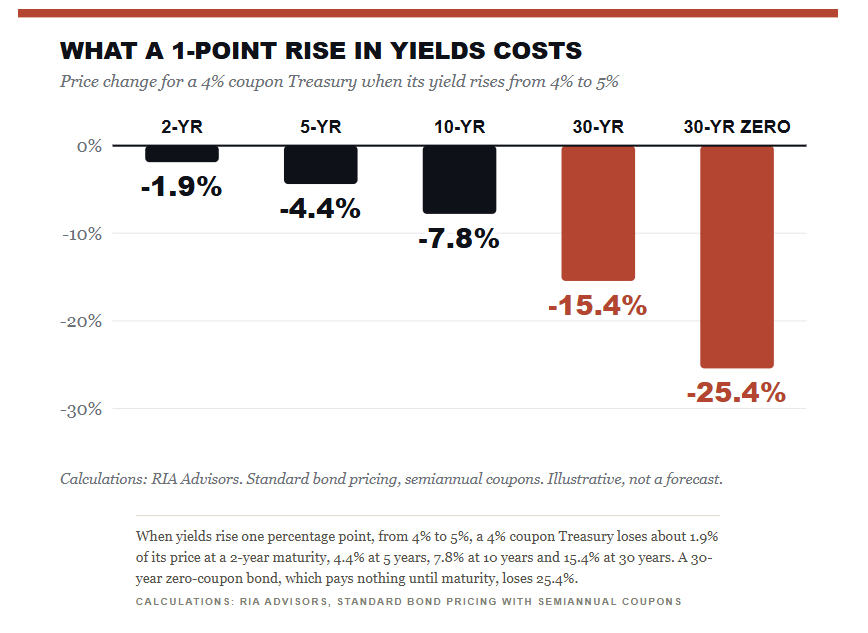
Notice the zero-coupon bond on the far right. It pays nothing until maturity, so all of its value sits at the end of the timeline. Every change in rates hits it with full force. That’s the instrument behind most of the dramatic “bonds crashed” headlines. The same math explains why the market treats something like a 100-year corporate bond as a bet on rates as much as on the issuer. Long duration is a volatility choice. It isn’t a statement about whether you’ll be paid.
The Types Of Bonds And What Each One Is Really Selling
The bond market is enormous and far less uniform than the stock market. A Treasury bill and a junk bond share a name and almost nothing else. A useful way to sort them is by what the buyer is actually being paid to accept. With Treasuries, you’re paid almost entirely for time and inflation. With everything else, you’re also paid to accept the chance that the borrower doesn’t pay you back. That second payment changes how the bond behaves when the economy turns.
Bond type | What you are paid for | How it tends to behave |
|---|---|---|
Treasury bills, notes, bonds | Time and inflation | Backed by the U.S. government. Bills mature within a year, notes in 2 to 10 years, bonds in 20 or 30. Usually rallies when stocks fall on growth fears. |
TIPS | Time, with inflation protection | Principal adjusts with CPI. Lower stated yield, but protects purchasing power when inflation surprises. |
Zero-coupon (STRIPS) | Time, all paid at the end | No coupons, highest duration for a given maturity. The most volatile Treasury there is. |
Agency and mortgage-backed | Time plus prepayment risk | Homeowners refinance when rates fall, so you get your money back when you least want it. |
Municipal bonds | Time, credit, tax advantage | Interest is often exempt from federal tax. Credit quality varies widely by issuer. |
Investment-grade corporate | Time plus modest credit risk | Higher yield than Treasuries. Spreads widen in recessions, which cuts into the hedge. |
High-yield ("junk") | Mostly credit risk | Trades more like stocks than Treasuries. Tends to fall when stocks fall. |
International and EM | Time, credit and currency | Adds currency swings that can swamp the coupon in either direction. |
Pay attention to the pattern in that table, as it matters more than any single row. As you move from Treasuries toward high yield, the coupon rises, and the bond starts behaving less like a bond and more like a stock. Junk bonds and stocks both depend on corporate cash flow, so they tend to get hit by the same recession. If the reason you own bonds is to cushion a stock market decline, credit risk works against that job. That doesn’t make corporate bonds bad. It means they’re doing a different job than Treasuries, one that pays you more in good times and asks you to share some of the pain when the economy rolls over, and you should know which one you hired.
The Most Misunderstood Difference: Bonds Versus Bond Funds
Most investors own bonds through a mutual fund or an ETF, and that changes the experience in one important way. An individual bond matures. A bond fund never does. The manager keeps selling bonds as they mature and buying new ones to keep the fund near its target maturity. As a result, the fund’s duration stays roughly constant forever. There is no date on which a bond fund promises to return a fixed amount to you.
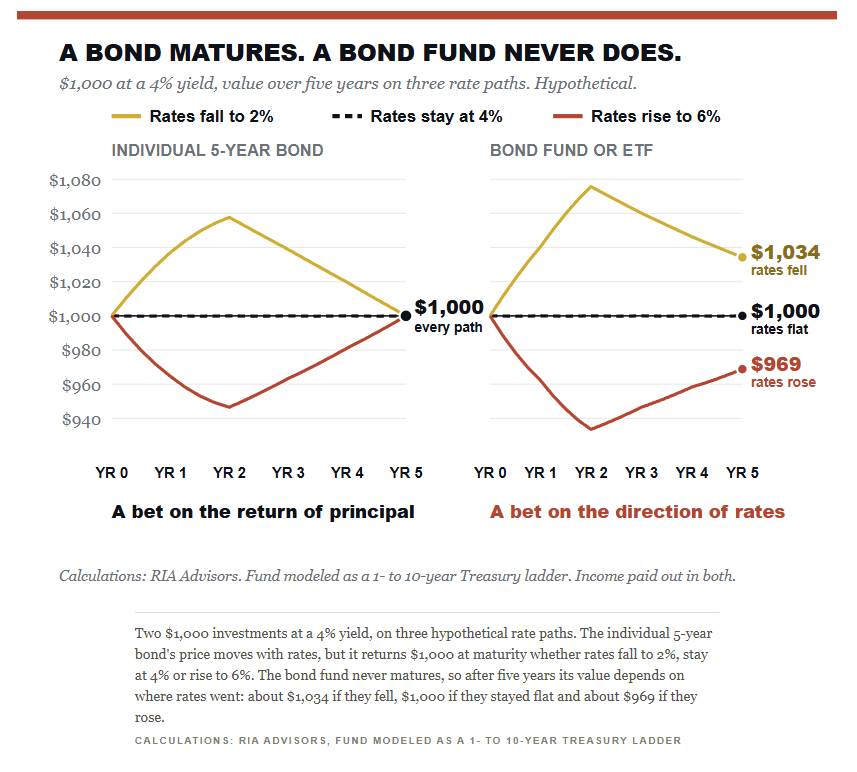
In other words, an individual bond held to maturity is a bet on getting your principal back on a known date. A bond fund or ETF is a bet on the direction of interest rates, because there is no date on which its price has to come back.
That’s not a flaw or a bug. Over long periods, a fund held through a rate cycle behaves much like an investor rolling a ladder of bonds. As yields rise, the fund reinvests maturing bonds at the higher rates, and its income rises with them.
Eventually, the fund’s total return converges toward the higher yield over a span roughly equal to the fund’s duration. However, and most critically, the “hold to maturity and get par back” promise only belongs to individual bonds. A fund holder only gets the equivalent outcome by staying put for at least that duration. Sell after a bad year, and the loss is permanent. That one behavioral difference explains a lot of the damage investors did to themselves in 2022.
How Are Bond Yields Set?
This brings us to how interest rates are set. Whenever rates rise, the “Perpetual Purveyors Of Doom” immediately start claiming “stagflation,” “the end of the dollar,” and the “bankruptcy of the country,” or some other nonsense to promote whatever product they are selling.
The reality is that bond yields are set by two groups: nobody and everybody.
No, I am not trying to be cute. The reality is that every yield you see quoted is the price at which the last buyer and the last seller agreed to trade, and that agreement reflects what both of them think growth, inflation, and the Fed will do over the life of the bond.
For new Treasuries, the government holds an auction.
Investors submit competitive bids stating the yield they’ll accept.
The Treasury fills the issue starting with the lowest-yield bid, and
Every winning bidder receives the highest accepted yield, called the “high yield.”3
Small investors can buy noncompetitively and simply accept whatever rate the auction clears at. After that, the bond trades in the secondary market. There, its yield moves every second with supply and demand.
So, what drives that demand? A 10-year Treasury yield can be broken into three rough pieces:
The inflation investors expect over the decade (current inflation rate)
The real rate they want on top of it (Real growth and productivity and the Fed’s rate path), and
A term premium for locking money up that long. (Sentiment)
I broke down the 10-year yield this way when asking whether the 10-year Treasury is finally a buy at 5%, and the graphic below uses those late September 2026 estimates.9
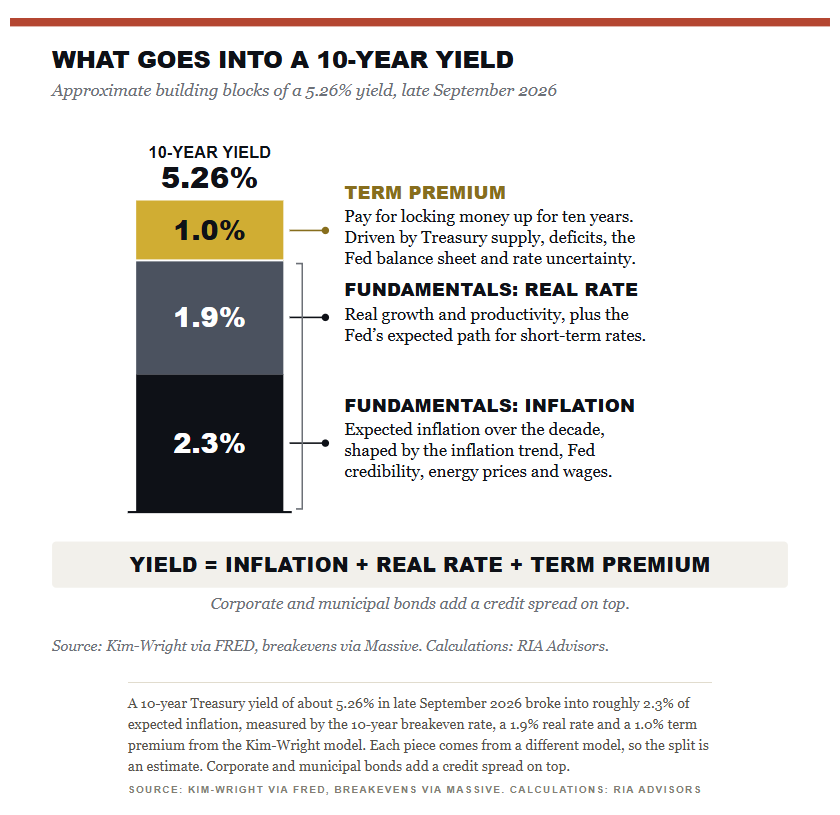
The first two pieces are fundamentals, set by growth, inflation, and the path the Fed is expected to take for short-term rates. The term premium is the swing factor. It moves with Treasury supply, the Fed’s balance sheet, and investors’ uncertainty about inflation’s path. Corporate and municipal bonds carry one more layer, a credit spread for the chance the borrower doesn’t pay, and that layer is the one that widens when a recession arrives.
The Federal Reserve sets the overnight rate, so it has a firm grip on the front end of the curve. It doesn’t directly set the 10-year or 30-year yield. Those are market prices built from expectations about the Fed path, inflation, and growth over the next decade or more. The Fed can raise its policy rate and watch long yields fall, because the market reads the hike as a future drag on the economy. It can also cut and watch long yields rise. That’s why “the Fed is raising rates” and “bond yields are rising” are two different statements. Investors who treat them as one are constantly surprised. Rate hikes work mainly on demand, which is why a hike won’t always fix inflation that starts on the supply side, as I discussed in A Fed rate hike won’t always fix the inflation it targets.
Do Deficits Drive Bond Yields?
There is a long-running debate over how much government debt and deficits move long-term yields. One camp argues that heavy issuance forces “bond vigilantes” to demand higher yields. The other points to long stretches when debt rose, and yields fell. That camp argues growth and inflation do most of the work. I’ve laid out the evidence in more detail in “Bond Vigilantes And The Waiting For Godot” and in what the data actually says about rising interest rates.
For the purposes of understanding how bonds work, the point is defined more narrowly. Whatever drives yields, the yield you lock in when you buy is the single best guide to what you’ll earn if you hold. Over shorter horizons, the market constantly reprices those building blocks. That repricing is the price noise that scares investors out of the asset.
The Bond Risks Every Buyer Has To Evaluate
Knowing how bonds work doesn’t mean bonds are riskless. They carry real risks, and they’re different from the ones stock investors are used to thinking about. The mistake is lumping them all together as “bonds went down.”
Risk | What it is | Who carries the most |
|---|---|---|
Interest rate (duration) | Price falls when yields rise. Temporary for a held bond, permanent if you sell. | Long maturities, zero-coupon bonds, long bond funds |
Inflation | Fixed payments buy less. The one risk holding to maturity does not fix. | Long nominal bonds when inflation is high and rising |
Credit and default | The borrower pays late, pays less or doesn’t pay. | High-yield corporate, weaker municipal and EM issuers |
Reinvestment | Coupons and maturing principal get reinvested at lower rates. | Short maturities and bill holders when rates fall |
Call and prepayment | The issuer repays early when rates fall, taking away your high coupon. | Callable corporates and munis, mortgage-backed bonds |
Liquidity | Selling before maturity costs a wide bid-ask spread. | Individual corporate and municipal bonds, small issues |
Currency | Exchange rates move the value of foreign bonds. | Unhedged international and emerging market debt |
Price Risk Versus Inflation Risk
Look at the first two rows together, because the difference between them is the heart of this article.
Interest rate risk is a mark-to-market risk. If you hold a Treasury to maturity, a rise in yields after you buy doesn’t change a single payment you receive. Inflation risk is different. It eats away at the purchasing power of every one of those payments, from the first coupon to the final return of principal, and holding the bond to maturity does nothing to stop it. The price decline everyone panics about is usually temporary, while the inflation risk almost nobody watches is the one that can make a bond a genuinely bad investment.
Reinvestment risk is the quiet mirror image of interest rate risk. When rates fall, your bond’s price rises, but the coupons you collect get reinvested at lower yields. When rates rise, the price falls, but every coupon goes back to work at a better rate. This is the trade-off that makes duration so useful. Over the holding period, which roughly equals a bond’s duration, the price effect and the reinvestment effect largely cancel out. The next section shows what that looks like with real numbers.
Why The Daily Price Change Is The Wrong Scoreboard
If you are new to investing in bonds, let’s build the one scenario where investors make the most mistakes.
You put $100 into a 10-year bond paying 4%. One year later, rates on comparable bonds have jumped to 6% and have stayed there. Your statement shows a loss of almost 14%. What happened to the “safe” part of your portfolio?
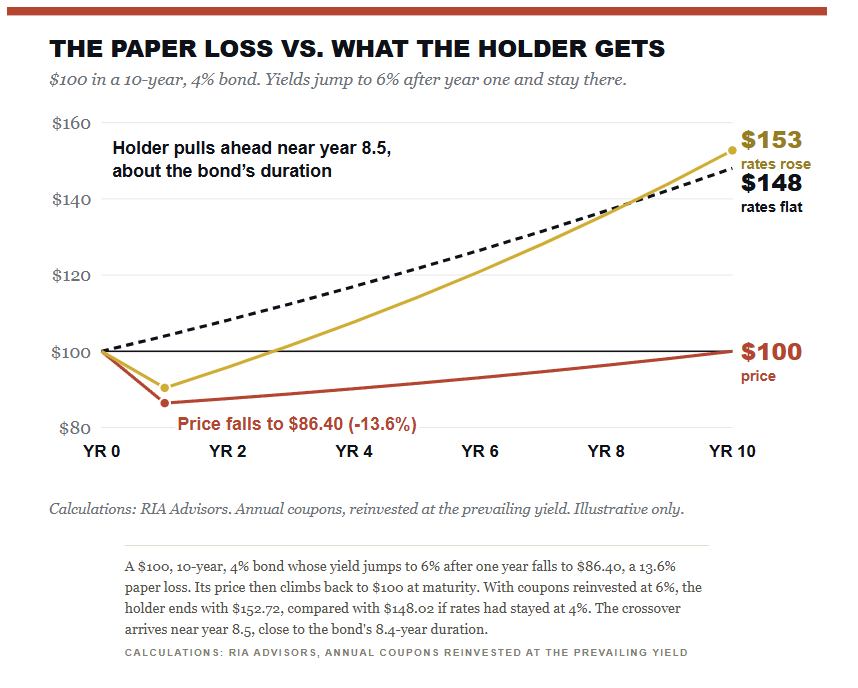
The answer is nothing. Notice in the chart above what the red line does after year one. It goes up. A bond’s price is pulled toward par as maturity approaches, because the final payment is fixed. The paper loss shrinks every year without rates having to fall at all. That is the “pull to par.”
Meanwhile, the holder is reinvesting every coupon at 6% instead of 4%. By year ten, the investor who suffered the 13.6% markdown ends up with more money than the one whose bond never lost a dime. The loss was real on paper. It was also temporary, and the higher rates that caused it ended up paying for it.
Will that work for an investor who sells after year one? No. Will it work for one who matches the bond to a time horizon and holds? Yes, as long as the issuer pays. That’s how bonds work for a buy-and-hold investor. It’s also why the useful question is never what the bond did last quarter. The useful question is what yield you’re locking in today.
Today’s Yield Is Tomorrow’s Return
The clearest evidence comes from more than a century of Treasury data. Using Robert Shiller’s monthly series, I measured the yield on the 10-year Treasury each month from January 1871 through December 2015, then calculated the annualized total return the bond actually delivered over the following 10 years.1 That gives 1,740 overlapping ten-year windows. I’ve made this point before, in asking whether the 10-year Treasury is a buy at 5%. To wit:
“Since 1881, the starting 10-year yield has explained roughly 91% of the variation in the bond’s return over the following decade.”
Extending the window back to 1871 doesn’t change the answer.
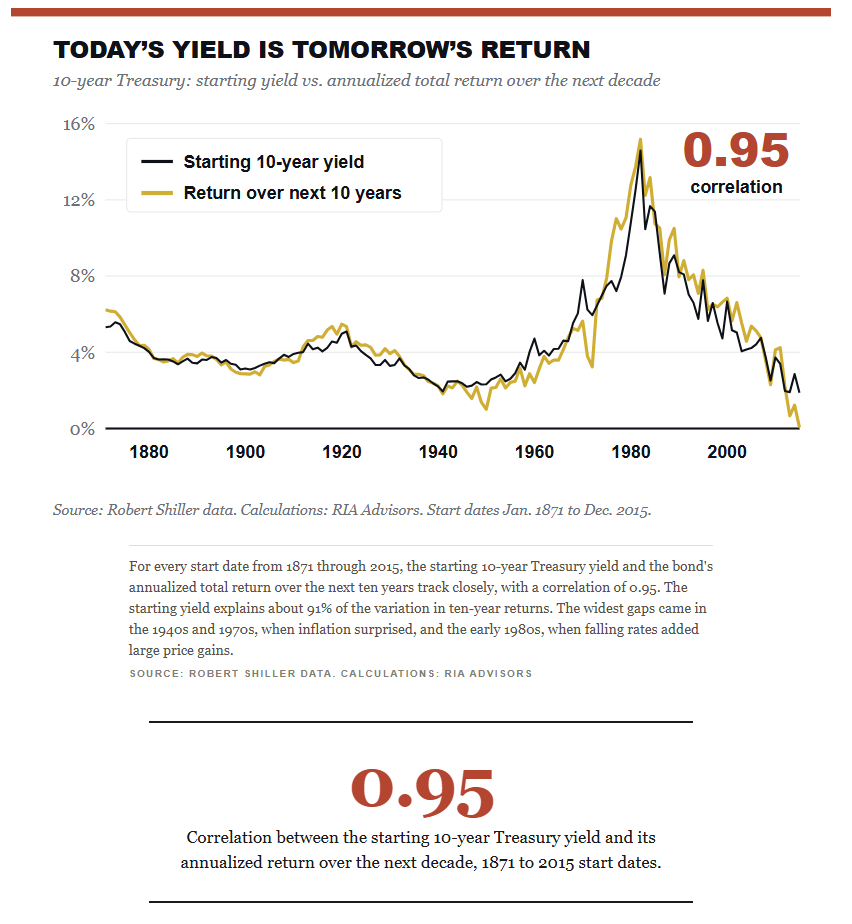
In 83% of those windows, the ten-year return landed within one percentage point of the starting yield. In 95%, it was within two points.
When the starting yield sat between 3% and 4%, the average ten-year return was 3.6%. When it started between 6% and 8%, the average was 7.3%. Above 8%, it was 11.3%, helped by the price gains as rates later fell. If you want to know what a high-quality bond will earn over the next decade, the starting yield has historically told you most of what you need to know.
Stocks offer nothing close to that kind of visibility.
Now compare that with how often a bondholder actually saw a loss, depending on how long they held.
Holding period | 10-year Treasury: periods with a loss | Stocks: periods with a loss |
|---|---|---|
1 year | 11.9% | 27.4% |
3 years | 4.6% | 15.2% |
5 years | 2.4% | 10.3% |
10 years | 0.0% | 2.9% |
Since 1871, about one in eight rolling one-year periods produced a loss on the 10-year Treasury. Not one rolling ten-year period did. The worst decade in the data still returned about 0.1% a year in nominal terms, and it started from a yield of only about 2%. Stocks, for comparison, lost money in more than a quarter of one-year periods and in about 3% of ten-year periods.1 The one-year number is what shows up in the headlines. The ten-year number is what the contract was built to deliver.
“The price on your bond statement is someone else’s opinion of your contract. The yield you locked in is the contract.”
Where The Bond Bears Are Right
“Bonds are broken.” The bears have a real point, and it isn’t the one they usually make. Short-term price declines aren’t the problem. The problem is that a nominal bond can keep every promise it made and still leave you poorer, because the promise was written in dollars, and dollars can lose value faster than the coupon pays. Such is the risk that deserves the attention the daily price change gets.
This point matters, and in the chart below, I rebuilt a test that sorts every rolling three-month window since 1900 by two factors: the inflation level at the start and whether it rose or fell over the following three months. Then I measured the 10-year Treasury’s annualized real return, after inflation, in each bucket.1,5
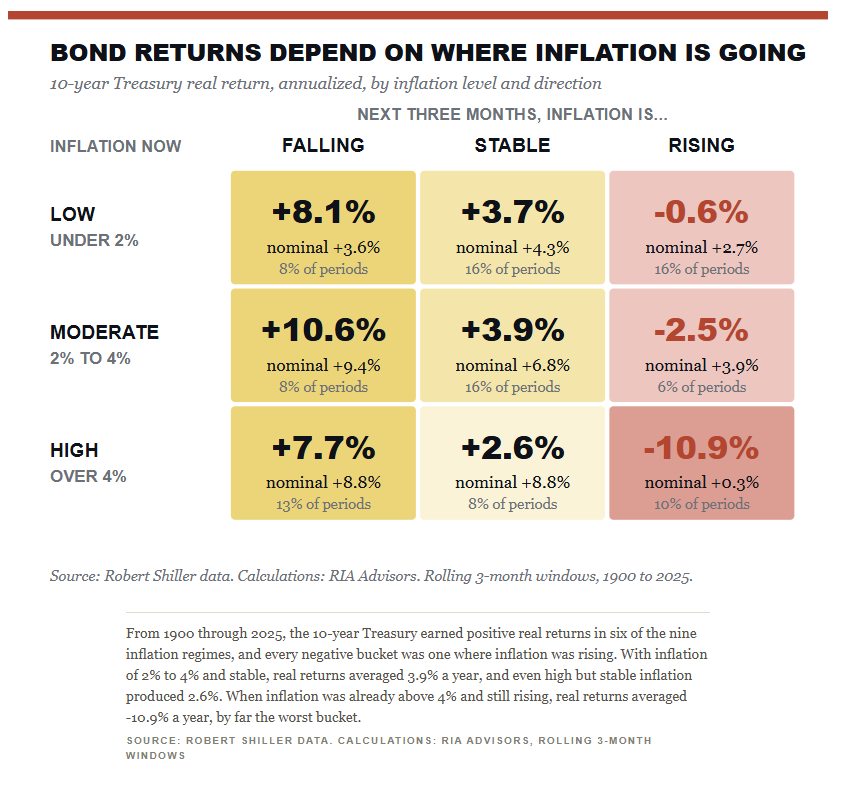
Notably, the result runs counter to the popular framing by bond bears. High inflation by itself has not been the bond killer they point to. When inflation was 4% and falling, Treasury bonds earned real returns that averaged nearly 8% annually. This is partly because starting yields were high.
However, the “damage” is concentrated in the lower-right corner: inflation, high and rising. That bucket shows up about 10% of the time, and when it does, real returns average -10.9% a year. Rising inflation from a low or moderate level costs something too, between half a point and two and a half points a year in real terms, but it’s nothing like the high-and-rising regime. The question that matters to a bond investor is the direction of inflation, not its level.
The long-run record carries the same warning. In nominal terms, no ten-year holding period lost money. After inflation, about 28% of them did. The worst stretch began in September 1971 and saw real terms lose 5.4% per year over the following decade. The 1940s, when rates were held down while inflation ran hot, produced a similar story. Those are the two periods the bears point to, but those decades don’t reflect the vast majority of history.
What Went Wrong In 2022
Then there’s 2022. Stocks and bonds fell together; the 10-year Treasury lost 17.8% for the calendar year, its worst in the NYU Stern dataset going back to 1928,2 and the “bonds always hedge stocks” story broke in front of everyone. It’s worth being specific about why. Inflation was already high and rising, the exact regime the chart above flags. Starting yields were also near historic lows, so there was almost no coupon to cushion the price decline. Both conditions were visible in advance, but described a market where starting yields are well above inflation.
So the bears have the diagnosis partly right. Bonds are vulnerable to accelerating inflation and are a poor deal when yields are below the inflation rate.
Where they go wrong is in turning those conditions into a permanent verdict. The same data show that high-quality bonds have done their job when starting yields are healthy, and inflation is stable or falling.
Why Own Bonds At All?
If bonds can lose to inflation and won’t keep up with stocks over the long run, why bother? The answer is in how bonds work inside a portfolio. A portfolio isn’t a contest to own the single highest-returning asset. It’s a plan to navigate an unknown future without the emotional pressure to sell the wrong thing at the wrong time. High-quality bonds do four jobs that are hard to find elsewhere.
The first job is one you can count on for income. A Treasury’s coupon is set on the day you buy it. It doesn’t depend on earnings, dividend policy, or anyone’s mood.
The second is a known value at a known date. If you need a specific sum in seven years for a retirement income gap, a tuition bill, or a home purchase, you can match it almost exactly with a seven-year bond. No stock can do that.
The third job is the one that matters most when it matters: protection during the economic shocks that hurt stocks the most.
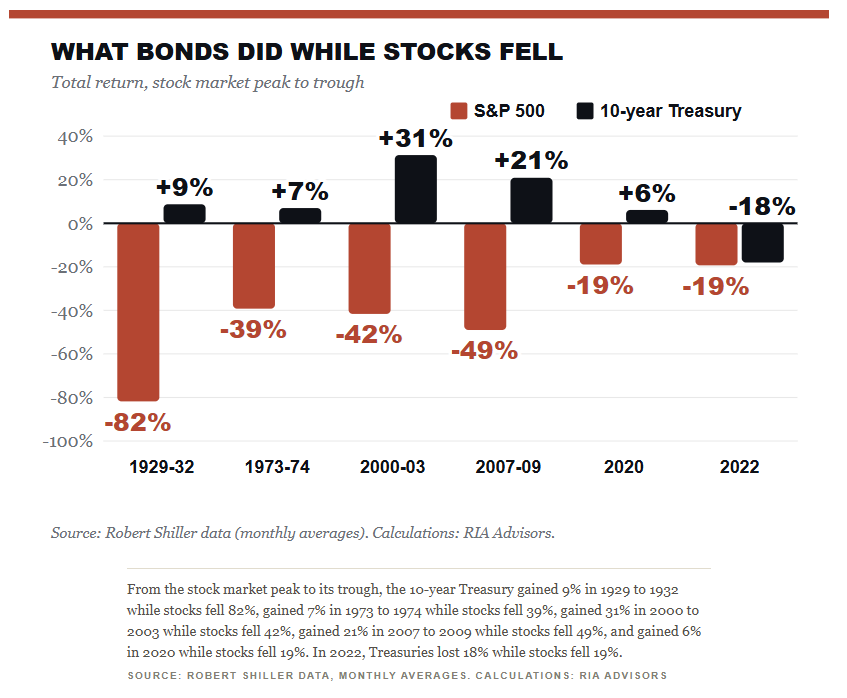
Across the 12 stock market declines of 15% or more since 1926, the 10-year Treasury posted a positive return in 10.1,7 Recessions and financial panics push investors toward safety and push the Fed toward lower rates. Both lift Treasury prices.
There have only been two exceptions in history when the bond hedge failed. The first was from 1968 to 1970: during that period Treasuries slipped about 3% while consumer prices climbed more than 9%. The second was in 2022, when they lost 18% as inflation surged.
However, we must also look closely at 1973 to 1974. During that period, Treasury bonds gained 7% in nominal terms, but consumer prices rose about 22% over the same stretch. The hedge held against the stock decline, but it still lost purchasing power. That’s the inflation caveat from the previous section showing up again.
The Behavioral Job Nobody Talks About
The fourth job is behavioral, and it’s the one that most investors underrate. Bonds are the dry powder that lets you rebalance into stocks after a decline instead of selling them. Treasury bonds also keep you invested because a smaller drawdown is a lot easier to sit through. In the next section, we will put numbers on how much smaller it is. Joe Wiggins made the point cleanly in a recent post.
“Diversification is about building a portfolio for a range of future paths that are at best uncertain.” – Joe Wiggins, Behavioral Investment4
That’s the part the price-chart crowd misses. Bob Farrell’s Rule #9 reminds us that “when all the experts and forecasts agree, something else is going to happen.” The years when everyone agrees bonds are pointless are rarely the years you wish you’d owned fewer of them. Bonds earn their place by doing well in some of the futures you can’t predict, and investors who drop them after a bad stretch are usually extrapolating the last few years into all of them.
How Bonds Work To Lower Portfolio Volatility
Owning bonds costs you something over the long run. Stocks have outperformed Treasuries by a wide margin, so every dollar moved into bonds lowers the expected return. What that dollar buys is a smoother ride, and the trade has historically been far better than most investors assume. The chart below blends the S&P 500 and the 10-year Treasury in different mixes from 1926 through 2025, rebalanced monthly, and compares each mix’s annual return with its volatility.1,8
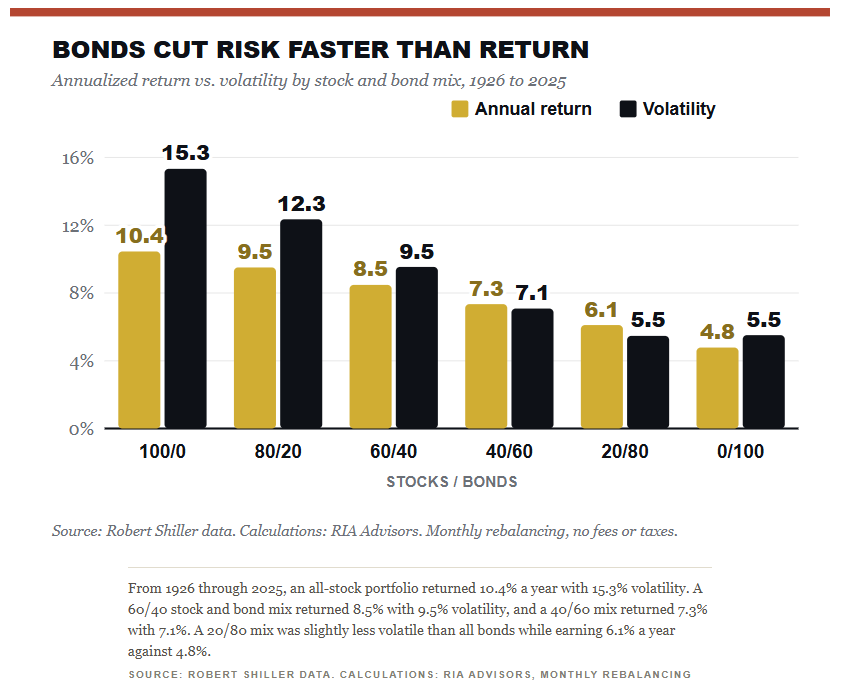
Notice in the chart above how the two bars shrink at different speeds. Moving from all stocks to 60/40 kept about 81% of the stock market’s annual return. It kept only about 62% of the volatility. In other words, portfolio volatility fell roughly twice as fast as return as bonds were added. The downside numbers are where that shows up in an investor’s actual experience.
Stocks / bonds | Annual return | Volatility | Worst 12 months | Largest decline |
|---|---|---|---|---|
100 / 0 | 10.4% | 15.3% | -62.3% | -81.8% |
80 / 20 | 9.5% | 12.3% | -53.1% | -73.1% |
60 / 40 | 8.5% | 9.5% | -42.2% | -61.0% |
40 / 60 | 7.3% | 7.1% | -29.4% | -44.3% |
20 / 80 | 6.1% | 5.5% | -16.5% | -21.7% |
0 / 100 | 4.8% | 5.5% | -17.0% | -25.2% |
So, why does adding a modest slice of bonds do so much? Volatility doesn’t add up the way returns do. In a portfolio, the swings depend on how much each piece moves and how the pieces move relative to one another.
Historically, Treasuries swung about a third as much as stocks over the same period, and the correlation between monthly stock and bond returns since 1926 has been close to zero, about 0.04. When two assets don’t move in lockstep, the swings of each asset partially cancel out rather than add up, which is why the 20/80 mix earned more than all bonds while remaining slightly less volatile. That’s diversification doing actual work.
When The Volatility Cushion Gets Thinner
The correlation isn’t constant, and it follows the inflation story from earlier. From 1966 through 1999, an era dominated by inflation, the monthly correlation between stocks and bonds averaged about +0.28. From 2000 through 2021, when growth scares were the main risk, it was about -0.32, and Treasuries rallied in almost every serious sell-off. Since 2022, it has turned positive again, at roughly +0.36. When inflation is the threat, stocks and bonds tend to fall together. When growth is the threat, they tend to move apart.
Most notably, even during the positive-correlation stretches, bonds still lowered portfolio volatility because their own swings were much smaller. The only thing that actually changed was the size of the benefit.
For example, from 1966 to 1999, a 60/40 stock/bond mix carried about 71% of the stock market’s volatility, and about 72% since 2022. That is compared with 57% from 2000 to 2021.
In other words, a bond allocation has dampened the ride in every era, but it hedges best when the economy’s problem is growth rather than inflation. That’s one more reason to monitor inflation and to lean toward shorter maturities or TIPS when inflation is the dominant risk.
How Bonds Work In A Portfolio: Putting It Together
“Okay, I get it. But what now?”
That’s a great question, and while understanding how bonds work is important, we must also understand how to use them. First, however, I need a quick disclaimer for compliance purposes.
“None of what follows is a recommendation for any individual situation. The right mix depends on your goals, taxes, and time horizon.”
However, there are a few principles that fall straight out of the evidence above.
The first step is to match “duration” to your time horizon. If you’ll need money in five years, a bond or ladder that matures in about five years removes most of the interest rate risk from your plan, because the price swings in between don’t change what you’ll receive. With a long horizon and the patience to hold through a full rate cycle, longer duration becomes a deliberate choice instead of an accident. Investors who are hurt by rate risk are usually those who buy bonds with durations beyond their time horizon.
Match Each Bond To Its Job
Secondly, know whether you own bonds or a bond fund. A ladder of individual Treasuries gives you specific dollars on specific dates. However, a bond fund or ETF gives you diversification and convenience, but its duration never shrinks. Its version of “getting par back” only arrives for holders who stay put for at least the fund’s duration. Both are reasonable. Confusing them is not.
What is most critical is the decision you make about which job each bond is doing.
Treasuries are the hedge,
Corporate bonds add income with some equity-like risk, and
Municipal bonds can make sense in a taxable account.
Mixing them is fine, but expecting junk bonds to protect you in a recession is how the hedge quietly disappears.
Third, watch the direction of inflation MORE than the level. TIPS and shorter maturities are available in regimes with high and rising inflation. That’s the one environment where a heavy allocation to long nominal bonds has historically done real damage.
Lastly, use the starting yield as your expectation and judge your bonds on the horizon you bought them for. A bond yielding 4% that drops 8% in a year hasn’t broken. Its expected return over the contract’s remaining life just went up.
Bottom Line
A high-quality bond's return is set mostly by the yield you lock in and by inflation, not by the price swings in between, so judge it by the contract and the horizon you bought it for.
The bond market will scare investors out of bonds again. It always does, and it usually does it right after yields have risen enough to make them worth owning.
Questions This Article Answers
How do bonds work in simple terms?
A bond is a loan to a government or company. The borrower pays a fixed interest rate on a schedule and returns your principal on a set maturity date. The bond’s market price moves with interest rates, but if you hold an individual bond to maturity and the issuer pays, you receive exactly the coupons and principal the contract promises.
Why do bond prices fall when interest rates rise?
A bond’s coupon is fixed. When new bonds offer higher yields, an older bond paying less is only attractive at a lower price, so its price falls until its yield matches the market. In this article’s example, a one-point rise in yields costs a 10-year Treasury about 7.8% and a 30-year Treasury about 15.4%.
Can you lose money on a bond held to maturity?
On a high-quality bond held to maturity, the nominal payments are fixed, so rising rates don’t change what you receive. You can still lose purchasing power to inflation, and you can lose money if the issuer defaults. Since 1871, no rolling ten-year period produced a nominal loss on the 10-year Treasury, but about 28% produced a loss after inflation.
How are bond yields determined?
New Treasury yields are set at auction, where the highest accepted competitive bid sets the rate. After that, yields move in the market with expectations for the Fed’s policy rate, inflation and a term premium for locking money up, plus a credit spread for non-government bonds.
Is the starting yield a good predictor of bond returns?
Historically, yes, for high-quality bonds held for about ten years. Since 1871, the starting 10-year Treasury yield has had a 0.95 correlation with the annualized return over the following decade, and the ten-year return landed within one percentage point of the starting yield 83% of the time.
Do bonds lower portfolio volatility?
Yes. Treasuries swing far less than stocks, and their returns have had almost no correlation with stock returns since 1926, so part of each asset’s swings cancels out. From 1926 through 2025, a 60/40 stock and bond mix carried about 62% of the stock market’s volatility while keeping about 81% of its return, and Treasuries gained in 10 of the 12 stock declines of 15% or more.
Sources And Notes
Robert J. Shiller, U.S. stock market and interest rate data (ie_data.xls). Uses the monthly long-term interest rate (GS10, long-term government yields before 1953), the monthly total bond return series, the S&P Composite total return series, and CPI. All study windows end in December 2025. Shiller’s bond returns are modeled using monthly-average yields, which smooth single-year results (2022 shows -15.0% in this series against -17.8% in the NYU Stern data), so they are used here for multi-year horizons and frequency statistics, not precise annual returns. Stock figures also use monthly averages and understate intra-month extremes. Calculations: RIA Advisors.
Aswath Damodaran, NYU Stern, Historical Returns on Stocks, Bonds, and Bills. Used for calendar-year 10-year Treasury returns and as an independent cross-check of the Shiller series.
U.S. Treasury, How Auctions Work, Treasury Direct.
Joe Wiggins, “Getting Bonds (and Diversification) Wrong,” Behavioral Investment, October 6, 2026.
Inflation regime method. Rolling three-month windows, January 1900 through September 2025 start dates (1,509 windows). Inflation level is the headline CPI year-over-year at the start of the window: low below 2%, moderate 2% to 4%, high above 4%. Direction is the change in year-over-year CPI over the window: stable within half a point either way. Returns are annualized. Real returns are deflated by realized CPI over the same window.
Bond pricing illustrations (price sensitivity and pull-to-par charts) use standard present-value pricing for a 4% coupon bond. They are hypothetical examples, not forecasts, and ignore taxes and transaction costs.
Stock decline episodes are peak-to-trough declines of 15% or more in the Shiller S&P total return series since 1926, measured on monthly averages (12 episodes). The 10-year Treasury return is measured over the same months.
Stock and bond mixes combine the Shiller S&P total return series and the 10-year Treasury total return series, rebalanced monthly, January 1926 through December 2025, with no fees, taxes, or trading costs. Volatility is the annualized standard deviation of monthly returns. Because both series are built from monthly averages, volatility and the worst declines are understated relative to month-end data, with the underestimation roughly equal across mixes. Era correlations use monthly returns.
Yield building blocks are approximate, late September 2026: expected inflation from the 10-year breakeven rate, the term premium from the Federal Reserve Board’s Kim-Wright model (FRED: THREEFYTP10), and the real rate as the remainder. The levels are an illustration and will change. The structure is what matters. First published in “Bonds At 5%: Is The 10-Year Treasury Finally A Buy?”
Disclosure. This article is for educational purposes only and is not a recommendation to buy or sell any security. Past performance does not guarantee future results. Bond investments are subject to interest rate, inflation, credit, and other risks.


Comments
Log in or sign up to join the conversation.