

Image Source: Unsplash
If only, like in the aftermath of the Apollo 13 explosion, we could just radio Houston to get started in figuring out just the way out of our fix. Mission Control would certainly buzz all the right people with the right stuff, summoning the best engineers and scientists from their quiet divans to the frenzied and dangerous work ahead.
Sadly, in this context all we can ever turn to are economists. And from Houston, we aren’t likely to extract any more oil.
The US economy has a big and growing oil problem on its hands. Of course, there is fallout potential from Ukraine, but this goes back quite a way into last year. Last October, in fact. Oil shocks never lead anywhere good, and though inflation isn’t good, that’s not where high oil prices take the economy. Remember ’08?
How about 1990?
"Yet, there was no overrun of money. On the contrary, the resulting oil shock far from reestablishing runaway inflation had contributed much – maybe most – to the nascent recession; following which, consumer price indices all decelerated sharply."
You don’t get the impression from mainstream commentary, yet markets are really pricing that very potential as I write this. The higher oil goes without the requisite system-wide money to make it real inflation, the likelier it goes in the historic direction of demand destruction.
And that presents the economy with its second great challenge of 2022. The more pain awaiting consumers at the gasoline station, the less everyone will have to spend on other things. This little more than the mechanism what turns oil-soaked upward CPIs into the downward direction for prices and economy together.
Just in time (pun intended) for the flood of goods to finally make its way out of 2021’s lumbering maze of transportation and shipping issues, therefore eroding discretionary budgets which further soften consumer spending right as consumer goods finally emerge from that logistical quagmire.
As the yield curve drops, is it all pessimism on Russia/Ukraine?
— Jeffrey P. Snider (@JeffSnider_AIP) March 1, 2022
A lot, sure, but not all. Cyclical indications are everywhere, too. pic.twitter.com/ufAwTb85MS
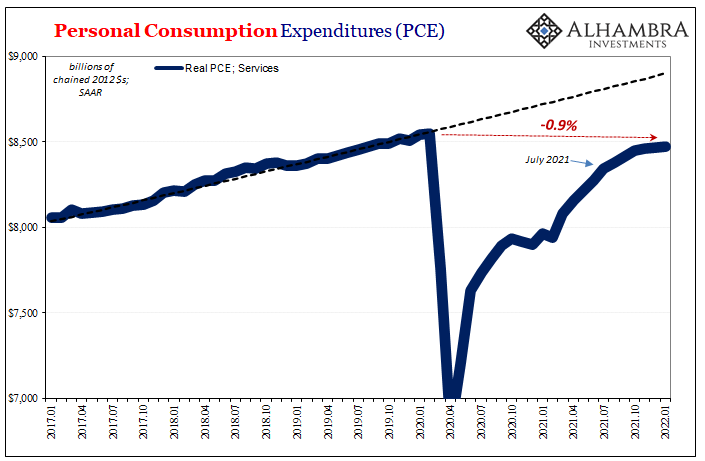
That would be bad enough even for the healthiest of economic situations. Despite the overheated narrative absolutely certain as to the overheating economy, ours is far from one. On the contrary, outside of those goods which had only presented a mirage in their own prices along besides skyrocketing crude in the CPI, the economy remains a relative wasteland everywhere else – particularly the much bulkier services sector.
The American goods sector has been the lone bright spot for the entire world’s struggling system. Can we, or anyone, afford even a little downside imbalance?
That’s where the marketplace happens to be already, with credit abuzz less than two weeks before the rate hikes begin and for reasons that have nothing to do with them. We’re always told that everything finance like money flows through the FOMC’s boardroom, yet, like 2008 and 2018, here’s another powerful example setting itself up to blow up in Jay Powell’s shocked face.
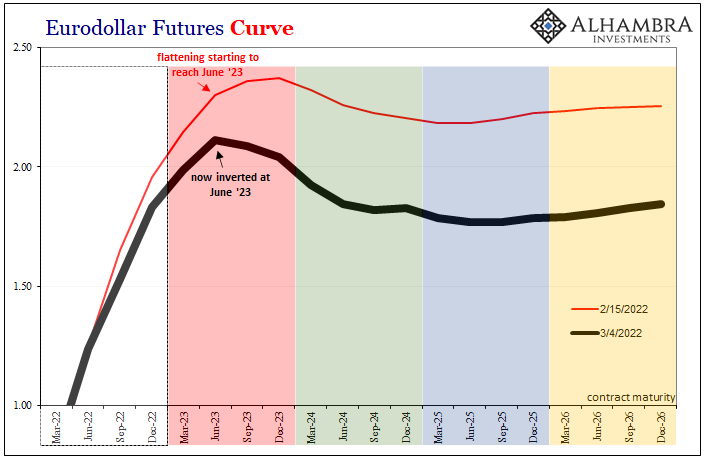
Starting with eurodollar futures, the curve moved sharply and importantly just from the other day. The inversion, which had previously moved into the reds, pushed even more red one contract over. This thing is broadening toward the front end at an alarming pace.
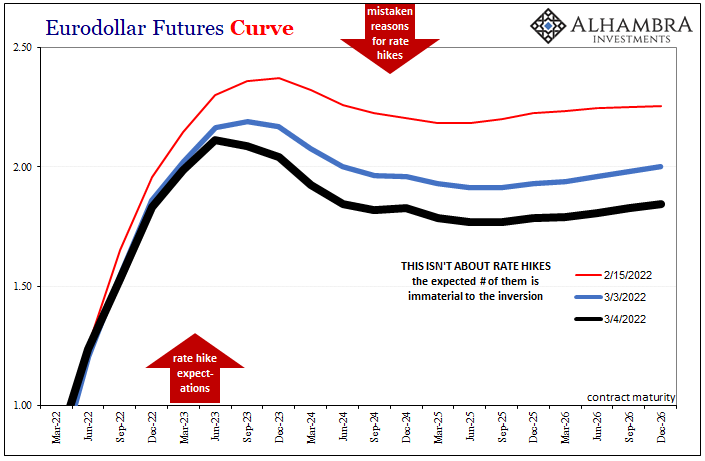
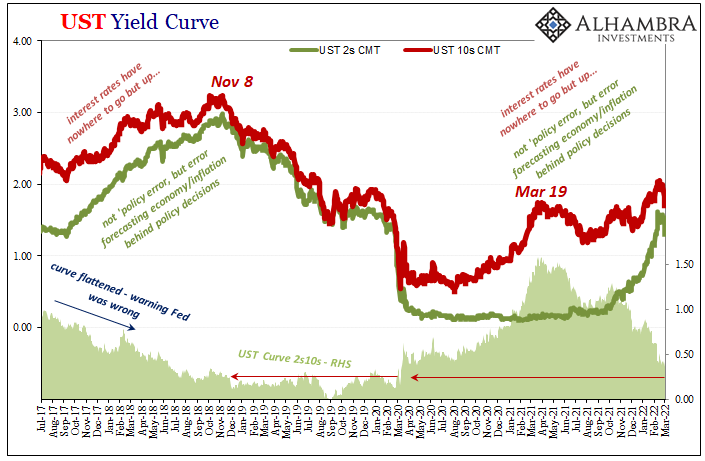
The same curve’s back end gets deeper. Top to bottom, it’s now 31.5 bps upside down as of Friday’s close. Meanwhile, the Treasury yield curve has continued to flatten as it retreats nominally. In the one part the public sometimes pays attention to, the 2s10s, or the spread between the 2-year note and the benchmark 10-year note, it has dropped to just 24 bps.
Since Feb. 10, when the BLS released its January 2022 CPI, the yield on the 2s has declined by 11 bps (including Friday) while the rate for the 10s has fallen by 29 bps. This, you’ll note, is absolutely consistent with the same distortions exhibited in the curve over in eurodollar futures (less rate hike-y, more bad probabilities anyway).
What does all this mean? Like I said from its very first day, with eurodollar inversion you never take it literally. When it initially showed up on Dec. 1, the kink in the curve was way, way out in the far blues.
Yet that didn’t mean the market was worried about some potential deflationary (money or economy) setback three years down the road. On the contrary, like last time in 2018:
"The correct way to interpret that inversion was the market pricing a rising and higher probability of rate cuts than rate hikes at some point.
"Eurodollar futures traders didn’t know what it would be, or really when this would happen, rather that initial inversion specified nothing so specific beyond rising deflationary risks of some sort of monetary breakdown creating substantial enough havoc it would lead to a total Fed one-eighty – as it did!"
Some future probability of deflationary trouble which could, if it continued unchecked, transform rather quickly into a more immediate threat.
As the same perceived threat which first upended the curve did linger and get worse, the inversion spread in both curve dimensions; depth as well as breadth. The expanding distortion forward in breadth meant the market priced the menace as more likely and more likely to strike not way out in time, rising probabilities, too, for it in the shorter run.
Inversion in the reds, for instance, is a more direct need to hedge for just around the corner. Red is supposed to be Fed.
Same with the yield curve. Though the 7s and 10s have spread a tiny bit since, each had touched (and intraday inverted) in the aftermath of last month’s CPI mania. Now the 2s10s have plunged down nearer to zero while the eurodollar uncertainty spreads unmistakably across both its directions.
Oil and inventory are that threat.
This doesn’t mean recession tomorrow; we’re still dealing in future probabilities here. The need to call up Houston (assuming anyone could) may be closer than anyone anticipates; certainly those leaning exclusively on the 3.8% unemployment rate, hoping somehow it represents a robust labor market which might act as some kind of shield against those gaining downside issues.
And those also include other more directly monetary problems, too.
If we are stacking up that BLS number against these curves yet again, we know the Fed will bet on the BLS and be wrong in doing so. This degree of distortion on both of the curves, that much is already priced in. What’s left to figure out, is how much time before it becomes too late.


Comments
Log in or sign up to join the conversation.