

Over the last decade, the general trend has been consistent: The rate of homeownership continues to struggle. The Census Bureau has now released its latest quarterly report with data through Q1. The seasonally adjusted rate for Q1 is 65.3 percent, up from Q4 2019. The nonseasonally adjusted Q1 number is 65.3 percent, up from the Q4 2019 65.1 percent figure.
The Census Bureau has been tracking the nonseasonally adjusted data since 1965. Their seasonally adjusted version only goes back to 1980. Here is a snapshot of the nonseasonally adjusted series with a 4-quarter moving average to highlight the trend.
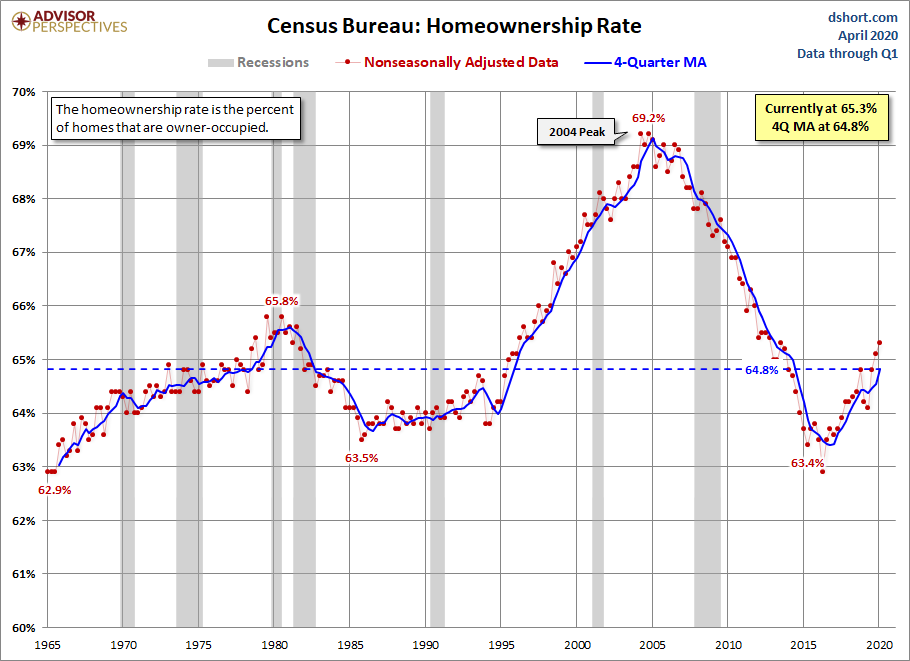
The consensus view is that trend away from homeownership is a result of rising residential real estate prices in general and limited supply of entry-level priced homes that would attract first-time buyers.
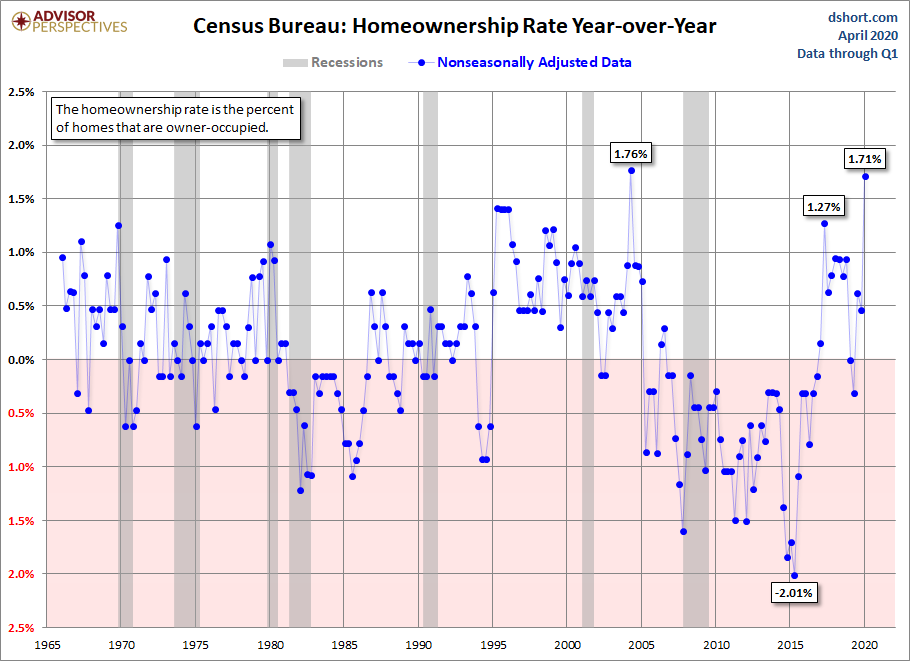
Here is the YoY version of the chart going back to 1965.
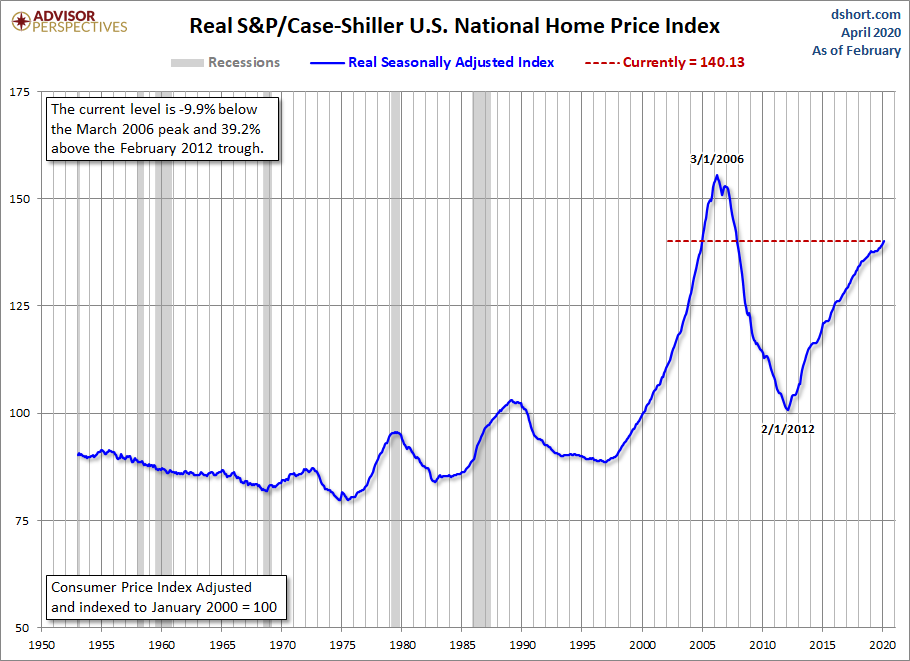
For an interesting comparison to prices, here is an inflation-adjusted look at the S&P Case-Shiller Home Price Index.
Homeownership Rates in Other Countries
The snapshot below gives us a crude comparison of the US homeownership rate compared to some select other countries. Our data source is a subset of the nearly four dozen countries in this Wikipedia entry on homeownership. We included the outliers at the top and bottom, Singapore at 91% (2018) and Switzerland at 43.4% (2015).
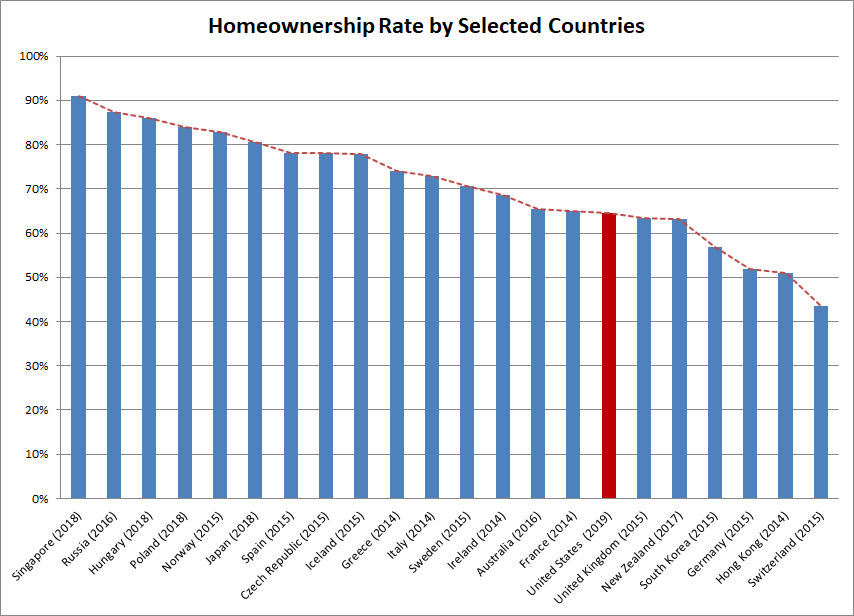
The underlying factors in the chart above are quite complex: Residential real estate affordability, financing options, household income distributions, demographics and cultural values, to mention some of the more obvious.



Comments
Log in or sign up to join the conversation.