


Micron stock has formed an ascending triangle pattern.
The company will publish its financial results this week.
The stock will likely continue rising in the near term.
Micron stock has crawled back and moved above the upper side of the ascending triangle pattern, pointing to more gains as its fourth-quarter earnings loom. MU rose to $1,082, up significantly from its July low of $737.
Micron stock to release strong results
MU stock will be in the spotlight this week as it releases its financial results, which are expected to show that its revenue surged in the fourth quarter as the AI boom accelerates.
All signs are that this will happen. For example, its last earnings report showed that its revenue jumped by 346% in the third quarter to $41.5 billion. This revenue growth was much better than what analysts and the management was expecting.
Micron has guided to its fourth quarter revenue coming in at over $50 billion, a move that will represent a 325% growth. Analysts, on the other hand, sees its revenue being over $51 billion. As such, the real result will likely be higher than that, possibly at $55 billion.
Micron’s growth is happening because of its strong presence in the AI data center industry, where its HBM chips are in high demand. This demand, coupled with the shortage, has helped the management hike prices, without losing market share.
Micron’s earnings-per-share are expected to be strong, with the average estimate among analysts being at $31.59, up from the $3.03 it made last year.
Analysts are bullish on Micron as its valuation remains friendly
Most analysts who follow Micron have a highly bullish outlook of the stock. Rosenblatt has a target of $1,500, while Wells Fargo has $1,400. Cantor Fitzgerald and Barclays see the stock rising to $2,000.
In addition to its strong revenue growth, analysts believe that the company is highly undervalued. For example, its forward P/E ratio has moved to 14.70, lower than the sector median of 25. It is also much lower than the S&P 500 Index average of 19.
The same is true with the forward PEG ratio, which stands at 0.03, also lower than the sector median of 0.68. Similarly, by adding its revenue growth and its margins, the company has a multiple of 390%, much higher than the key point of 40.
Micron share price has formed bullish technicals
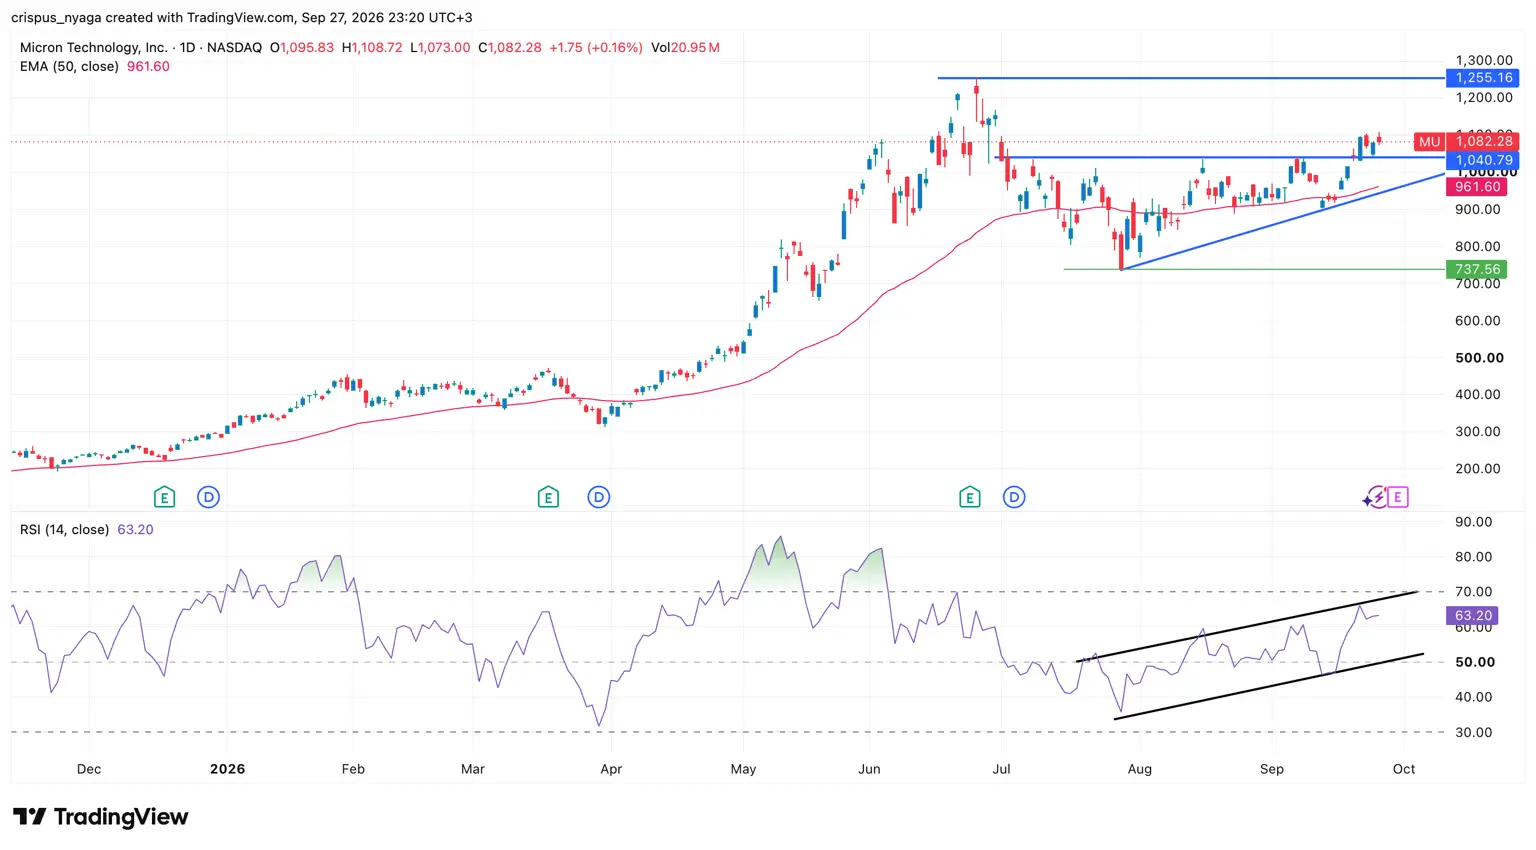
MU stock chart | Source: TradingView
The daily chart shows that it has formed an ascending triangle pattern, which is made up of a horizontal line and an ascending trendline. This pattern is one of the most common bullish continuation sign in technical analysis.
The stock has moved above the 50-day Exponential Moving Average (EMA). Also, the Relative Strength Index (RSI) has formed an ascending channel, which is a bullish sign.
Therefore, the stock will likely continue rising as bulls target the key resistance level of $1,255, its highest level on June 25. A move above that level will point to more gains, potentially to $1,500.



Comments
Log in or sign up to join the conversation.