

In our previous Sunday, December 5th Stock Market Update & Asbury Investment Management Video, we said:
“The S&P 500 finished last week (ending Friday Dec 5th) right on top of primary Tactical support at 4545. A significant and sustained decline below this support next week would confirm that a real corrective decline has begun, rather than just another one of the numerous 5%-ish minor pullbacks that have occurred since the beginning of the year.”
The chart below, an updated version of the one from that report, shows that the Dec 3rd test of support that we referred to actually held as the index aggressively rebounded during the following week. The chart also shows that another successful test of this support area took place on Dec 20th. The rapid back-and-forth trading activity that created both of those successful tests of support was indicative of investor indecision as shown by the red highlights.

S&P 500 daily since July
The green highlights point out that SPX rose out of this indecision area on Dec 27th, which suggests that the US broad market index’s larger 2021 advance has resumed and targets an additional 3.3% rise to 4950 which will remain valid as long as the upper boundary of the indecision area at 4723 now contains on the downside.
Meanwhile, the table below shows that the Asbury 6, our own daily risk management model, is currently Positive or bullish. Our model actually shifted back to a Positive status on Dec 22nd, two days after the second successful test of underlying support on Dec 20th. The S&P 500 has risen by an additional 5.4% since then.
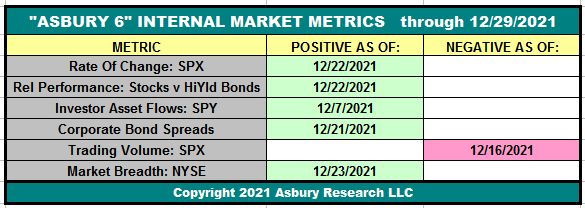
The Asbury 6 through December 29th
Video Length: 00:07:27



Comments
Log in or sign up to join the conversation.