

Bull markets don't die of old age -- I've heard this trope more than enough times, and while there's merit to this, it still bothers me that we're officially in the longest equities bull market ever and retail investors (as usual) are piling into the long side of the trade like there's no tomorrow. It's known as the "most hated bull market" for a reason: it's based not on a solid economic foundation, but on massaged employment and GDP numbers, a massive and continuous liquidity infusion from the world's central banks, and good old T.I.N.A.: There Is No Alternative to buying stocks because bond yields have been suppressed beyond recognition.
I would say that Paul Volcker is rolling in his grave, but he's alive and well and probably livid about the Federal Reserve's unwillingness to exercise anything resembling fiscal discipline. At this point, all the Fed wants is for inflation (currently 1.6%, if you choose to believe the government's released figures) to reach its target rate of 2% so they'll have the excuse they need to cut interest rates like a lumberjack.
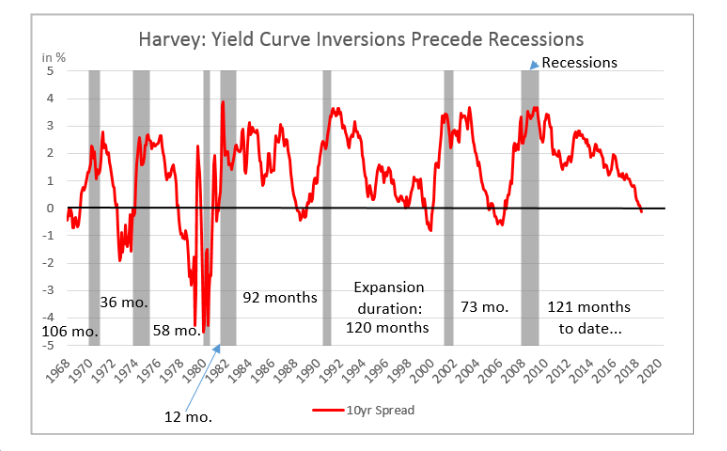
The result of this new fourth round of quantitative easing is a long-standing yield curve inversion, which has historically predated and predicted devastating economic contractions:
Courtesy: NPR
As you can see, whenever the 3-month Treasury yield is greater than the 10-year Treasury yield, an economic recession and stock-market crash is likely to follow. Indeed, this yield-curve inversion has reliably predicted a recession for the last seven instances, going all the way back to the 1960s, with no false signals yet. Moreover, the yield curve has remained inverted for three months (a full quarter), which for half a century has signaled that a recession is imminent in the next nine to 18 months.
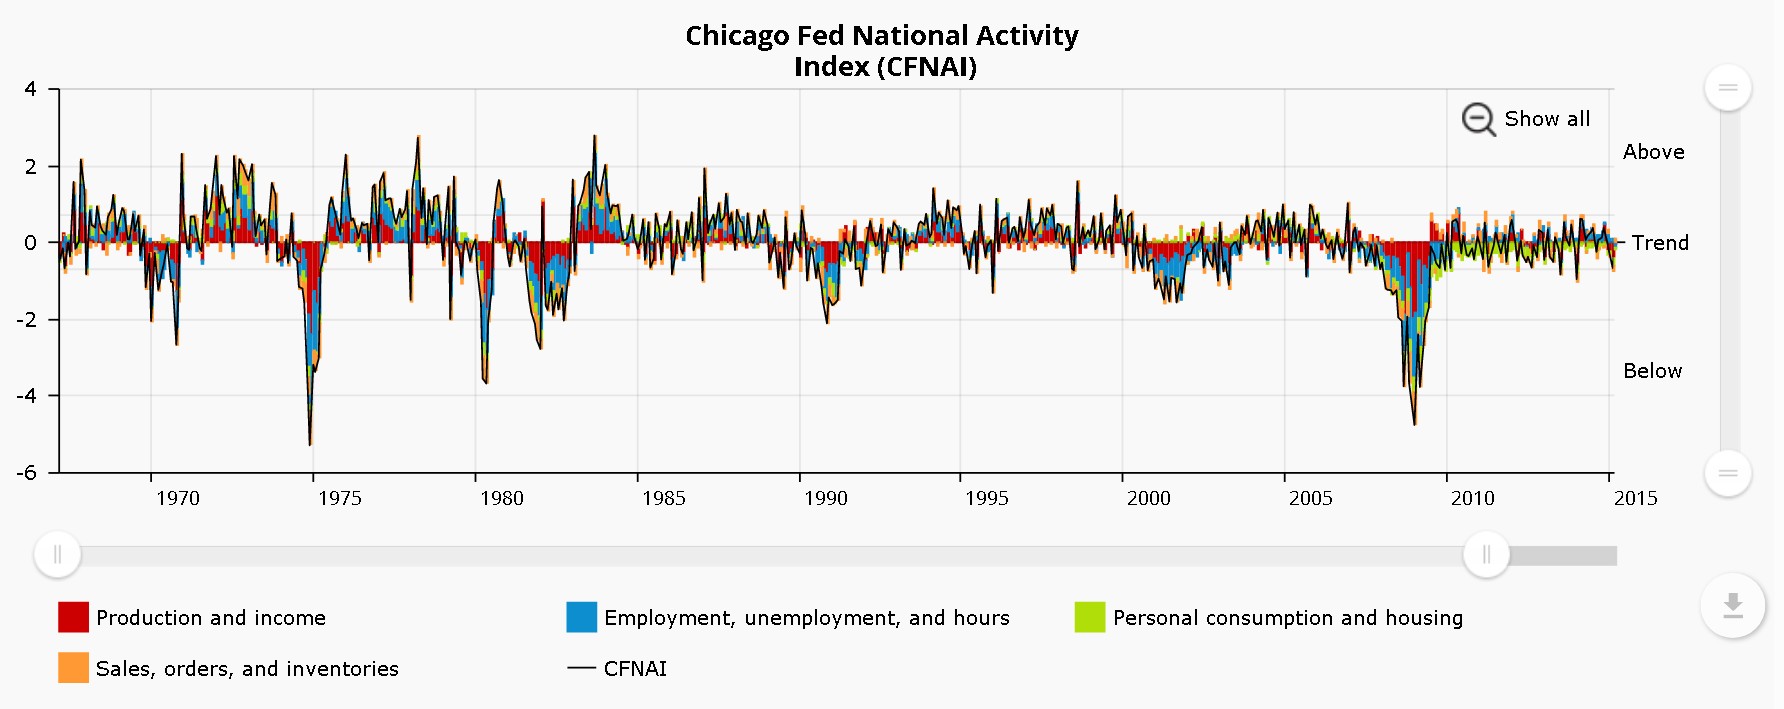
This is well-known, but to this we can add a much lesser-known recession indicator: the Chicago Fed National Activity Index, a monthly index that combines 85 indicators to measure the strength of the economy and inflation in the U.S.:
Courtesy: Chicago Fed
This indicator just came in at a -0.02 reading, clearly below economist expectations of a +0.1. This now marks the seventh consecutive month in which this index has come in negative. And, every prior streak of seven or more months of negative readings in the index has coincided with a recession.
Sure, market bulls can look at those two indicators and say, "It's different this time." Anyone who invested through 2000 and 2008 knows that those are famous last words, usually spoken at market tops by hapless retail investors. I'm not advising reallocating to an all-cash position, but as always -- and especially now -- caution is most definitely advised.


Comments
Log in or sign up to join the conversation.