
With mail-in voting already underway and with official in-person voting tomorrow, this week's issue takes one more look at hedge positioning before the election. However, more may be needed should the result be delayed. As option implied volatility spiked higher last week, several important indicators turned bearish. The Market Review explains, followed by one approach for trading high-implied volatility with an odd named strategy called Iron Condors including an example using the Invesco QQQ Trust (QQQ).
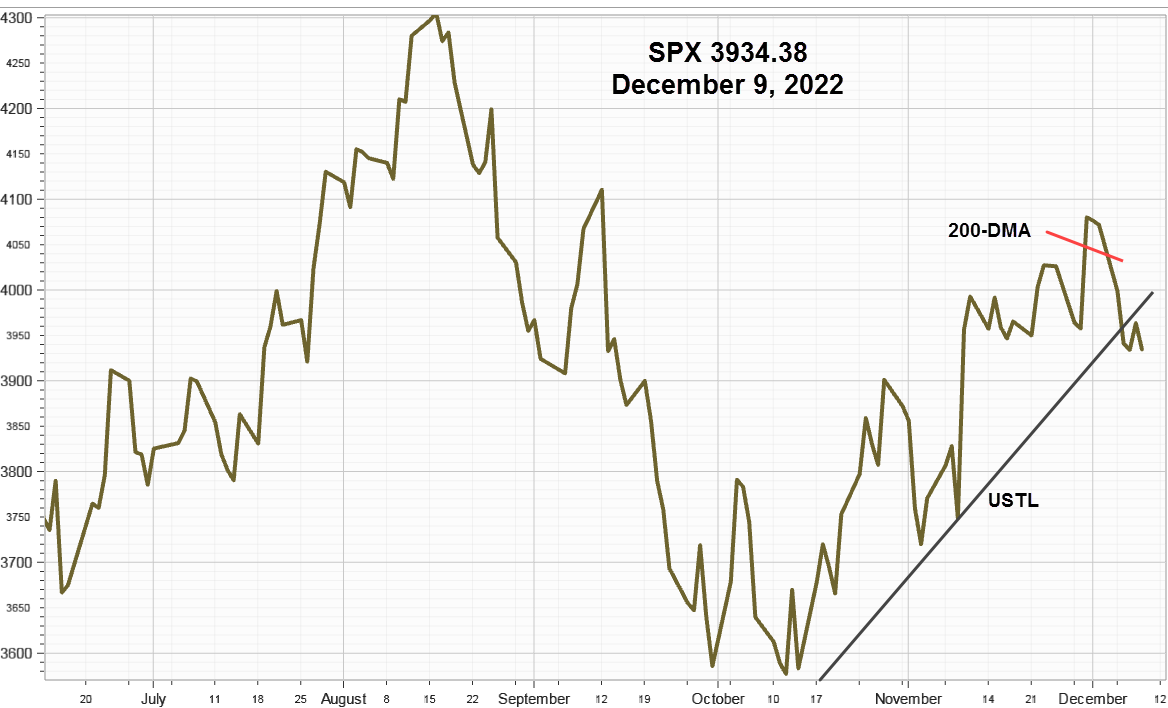
S&P 500 Index (SPX) 3269.96 suffered a 195.43 point or -5.63% loss last week with most of the decline on Wednesday. Trouble began last Monday as it dropped 64.42 points and closed below the 50-day Moving Average that had been supporting it for a week. Then Wednesday it opened gap lower and ended the day off 119.65 points. Now, it may find some support around 3200, but unless some positive news changes sentiment, a test of the 200-day Moving Average down at 3129.47 seems likely.
Invesco QQQ Trust (QQQ), 269.38, called "the decider," slid 15.36 points or -5.39% closing below the 50-day Moving Average last Wednesday. The declined continued on Friday after updates in some quarterly reports by leading growth favorites were characterized as underwhelming. By the end of the week, signs of rotation into cyclicals and beneficiaries of higher interest rates began appearing. However, the situation could change quickly with news of another fiscal support package sometime after the election. With some support around 260, the 200-day Moving Average crosses way down at 241.52.
CBOE Volatility Index® (VIX) 38.02 spiked 10.47 points or +38.00% higher last week. Our similar IVolatility Implied Volatility Index Mean, IVXM using four at-the-money options for each expiration period along with our proprietary technique that includes the delta and vega of each option, gained 33.39 points or +38.32%, ending at 33.39%, conclusively ending the wavy indecisive pattern since the start of September.
The IVXM and SPX charts follow.

This chart showing the spread between the VIX 30-day options and the VXST 9-day options gives a clear trouble signal as the shorter date options gained relative the longer-dated options and the spread turned negative. Since a positive spread is a normal condition, caution flags should fly until it turns positive again.

The 9-day VXST includes options that expire after the election and after the non-farm payroll report on Friday along with other uncertainty including Covid-19 reports.
Next, take a look at the Equity Only Put/Call ratio drifting higher until Friday when it spike up and closed at .77, higher than the previous spike up to .74 on June 26. This one gives a go signal when quickly drops lower again.

VIX Futures Term Structure
The term structure chart from our friends at vixcentral.com shows the 9-day short-term VIX in blue at 44.33, well above the 30-day VIX in green at 38.02. In addition, the entire curve slopes downward from November and remains abnormally high through January. All of the relationships paint a bearish and/or hedged condition.

The term structure reflects a willingness to pay more for November, December and January presumably to hedge portfolio risk using futures most sensitive to changes in the VIX, although they have the greatest loss of time premium and are in a constant state of rotation from the closest future to the next with little change in total the open interest as this chart shows.

VIX Futures Premium
This next chart shows our calculation of Larry McMillan’s day-weighted average between the first and second-month futures contracts as of last Friday.
With 12 trading days until November expiration, the day-weighted premium between November and December allocated 60% to November and 40% to December for a premium of -11.24% as the VIX spiked higher, vs. 4.42% on October 23.

Since most of the volume and open interest are in the two closest futures contracts measuring the day-weighted premium relative to the standard 30-day VIX provides a good real-time sentiment indicator based upon actual commitments of large Asset Managers and Leveraged Funds. Last week the entire futures curve shifted higher although both VIX measures spiked well above the curve as prices for SPX and SPY options increased more than the futures.
In Conclusion
What do all these chart mean since it's now obvious the markets are headed lower? First, they seem to confirm optimistic sentiment came head-to-head with deteriorating fundamentals and increased uncertainty; second, they offer relative quantification with prior periods and finally a way to tell when it may end. After all, the next fiscal support measure should make a difference.
Last week's signs of rotation supports the view of some participants that the air is starting to leak from the tech bubble. After all rising interest rates remove the extra oomph. However, unless a decisive big hole blows it apart small leaks can probably be repaired enough to keep it floating higher awhile longer.
Strategy
There are several alternatives to consider as implied volatility increases including Covered Calls, Short Puts, and Iron Condors.
An Iron Condor consists of two credit spreads, a Bull Put Spread, a Bear Call Spread, ideal for range-bound stocks, and ETFs with abnormally high options implied volatility. It's like being short the top and bottom of a defined range and benefits most if the underlying closes in the middle of the range so both spreads expire worthless at options expiration.
Option volume and therefore liquidity are important considerations. The greater the liquidity to narrower the spreads between the bid and ask prices for the two credit spreads. In addition, higher-priced stocks and ETFs have more option strike prices available. Shorter time to expiration means less risk of the underlying exceeding the range, but with lower total credits as well. Preferably set a stop loss should it approach either short strike by closing the threatened side while allowing the remaining side to expire, thereby reducing any potential loss.
Implied volatility should be high enough in order to produce sufficient revenue to make the trade worth the effort, ideally in the 40%+ range, preferably after implied volatility starts declining from a high level. While implied volatility will determine the total amount of premium in the trade, historical volatility also called realized volatility will determine the ETFs probability of exceeding the range during the position period. For example, if historical volatility is declining it means the daily trading ranges are becoming smaller or the rate of travel is declining.
Invesco QQQ Trust (QQQ), 269.38, called "the decider," for example.
With a current Historical Volatility of 27.82 and 20.87 using the Parkinson's range method, the Implied Volatility Index Mean is 37.38 up from 31.11 last week. The implied volatility/historical volatility ratio using the range method is 1.80 so option prices are moderately high relative to the recent movement of the ETF. Friday’s option volume was 1.7 million contracts with a 5-day average of 1.2 million contracts with reasonable bid/ask spreads.
First the short call spread,

Using the ask price for the buy and mid for the sell the credit on Friday was 1.68.
Next, the short put spread,

Using the ask price for the buy and mid for the sell the credit on Friday was 1.27. Total credit both sides 2.95. Today's option prices will be somewhat different due to the time decay over the weekend with only 12 days to expiration and any QQQ price change. Use the two short strike prices, 280 and 260 as the SU (stop/unwind) levels.
Summary
Both the S&P 500 Index and "the decider" Invesco Trust QQQ closed below their respective 50-day Moving Averages last week ending speculation of a possible advance before the election on Tuesday. Options and futures indicators confirmed the decline moving well into bearish territory. Signs of rotation into cyclicals and beneficiaries of higher interest rates may have played a role in the tech sector's inability to continue higher after growth favorites reported on Thursday. As option implied volatility rises, look for hedging and volatility trading opportunities.
Comments
Log in or sign up to join the conversation.