
It seems the little noticed Job Openings and Labor Turnover (JOLTS) report this past week have a few believing happy days are here with record high job openings. The authors of the report stated:
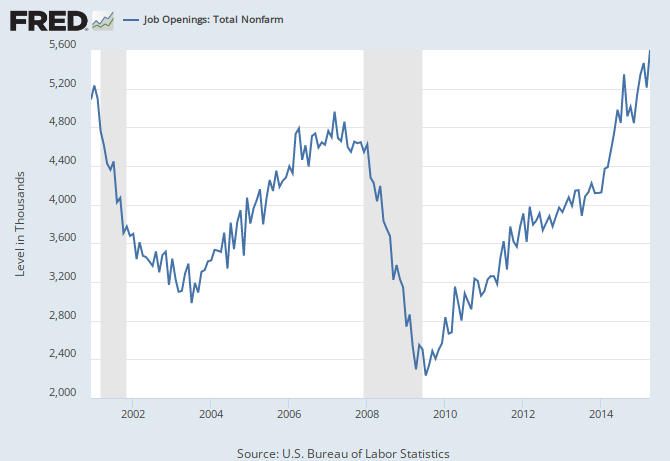
Job openings rose to 5.4 million on the last business day of April, the highest point since the series began in December 2000.

There is little question this is a positive event - but this data series has significant backward revision and cannot be relied upon in real time. [Note that it is not timely as it lags the BLS Jobs Situation report by over one month.]
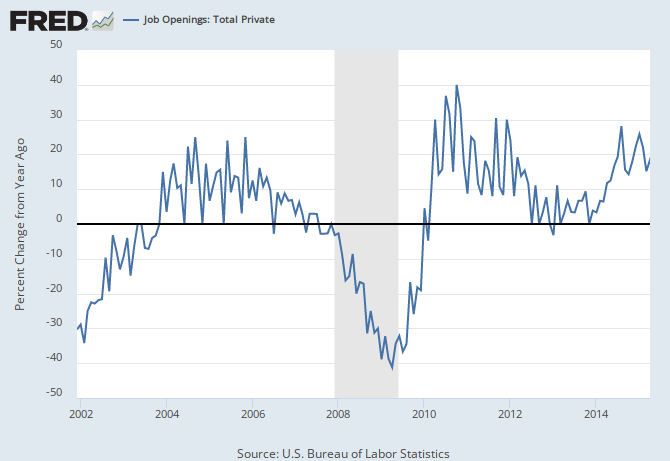
Rate of growth of job openings is not in record territory
Looking only at the totals is misleading. What one should be looking at is the rate of growth which is good, not excellent.
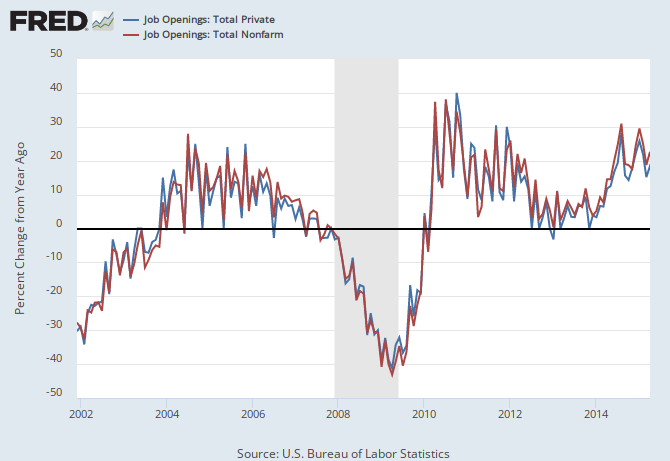
There are seasonality issues
Beginning mid-2014, there has been a noticeable divergence recently between the unadjusted and seasonal adjusted data. What this might signify is not clear - the data sets have insufficient history to make comparisons meaningful. The blue line in the graph below is unadjusted, while the red line is seasonally adjusted.
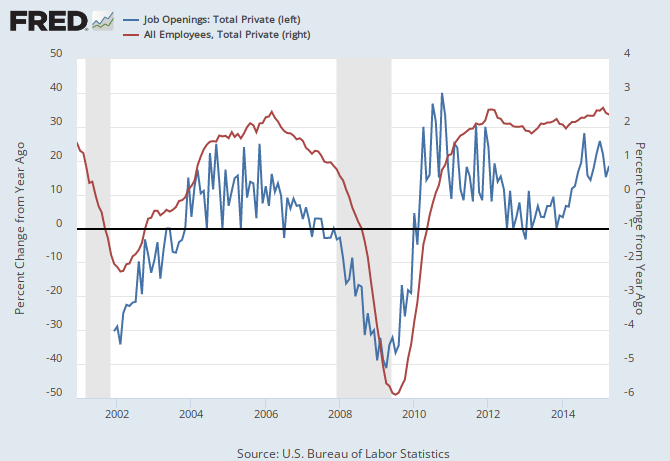
There is a loose correlation between JOLTS and jobs growth
In general, when JOLTS rate of job openings grow - the rate of jobs growth grows. The recent peak of JOLTS rate of jobs growth was in August 2014 - and is currently in a downward trend.
We have been predicting a decline in the rate of jobs growth
Not only Econintersect, but also the Conference Board has been forecasting a decline in the rate of jobs growth. Of course, the decline being forecast is rather mild - but the methodologies used to forecast are as different as day-and-night. Econintersect does not use jobs data to derive its forecast - but uses non-monetary data points which are not subject to backward revision.
The chart below compares BLS Non-Farm Employment Year over Year (Blue line, left axis) with Ecointersect Employment Index Year over Year Improvement (redline, left axis) and the Conference Board ETI Year over Year Improvement (yellow line, right axis).

Conclusion
Reading too much into a single data set leads to incorrect conclusions. I am rather pleased with the rate of employment growth in spite of the headwinds of global trade (and the slow growth in some global economies and slowing growth in others) and robotics. Historical correlations are problematic as the labor environment continues to change. The JOLTS report is good news, just not excellent news.


Comments
Log in or sign up to join the conversation.