


That was quite a month! Let’s catch up with some major indexes.
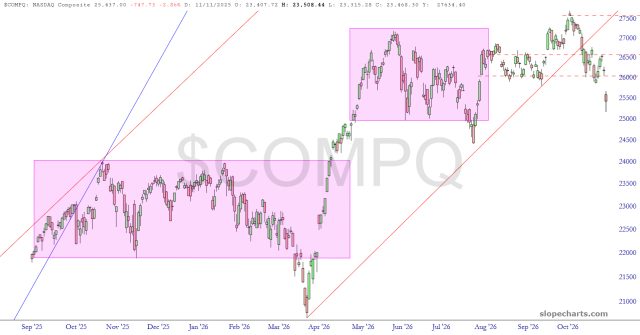
The Nasdaq Composite had a hard break on Friday and closed at a multi-month low. Not only is the trendline broken, but a clean topping pattern is in place. On top of this, someone mentioned to me something about an election on Tuesday.
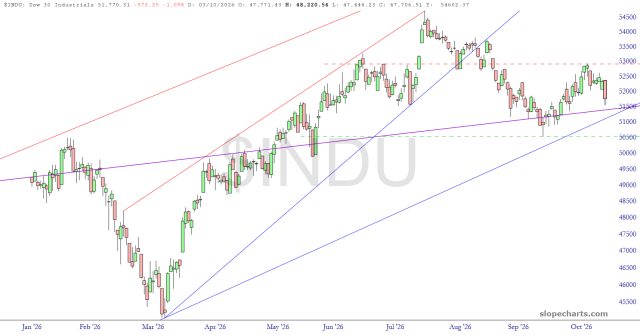
The Dow’s reversal isn’t as well-formed. There are three levels to crack to set this fully in motion lower, and they are quite close: the two trendlines and then the horizontal (dashed). Getting below the horizontal would complete a massive H&S top.
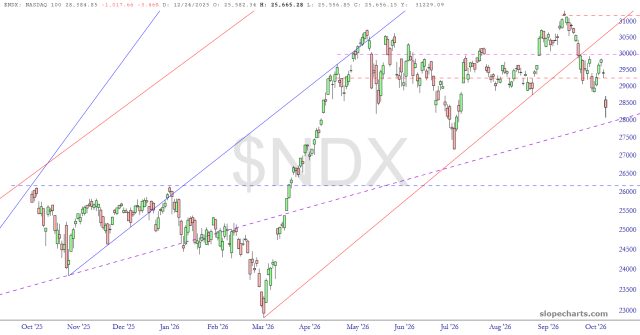
The Nasdaq 100 has the same benefits as the Composite: a long-ago broken trendline and a nice new price gap anchored to Thursday’s low.
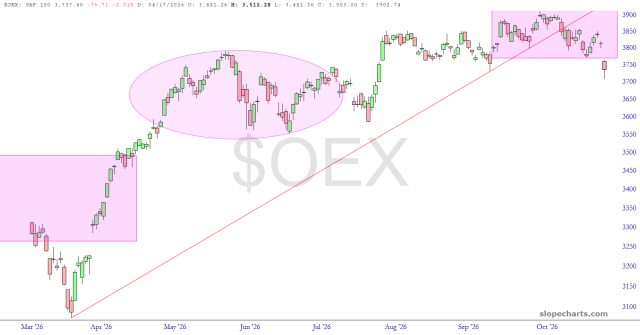
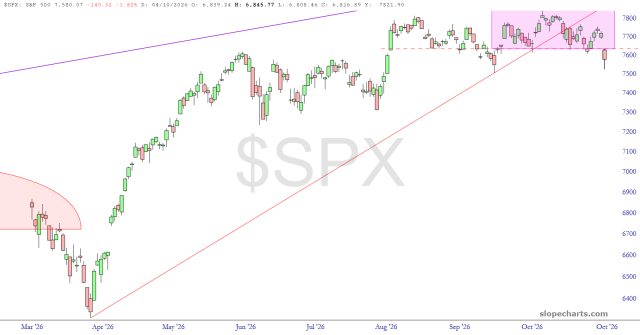
The S&P 100 has completed an H&S top already. It isn’t huge, so the measured move isn’t substantial, but – I’ll take it!
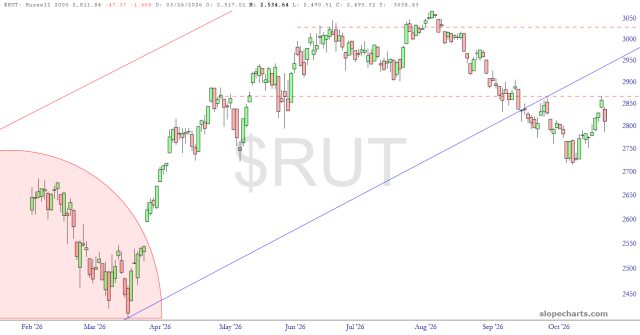
The strength small caps have shown lately is entirely due to the dropping of interest rates for most of October. If rates start creeping higher again, the small caps are going to slump hard.
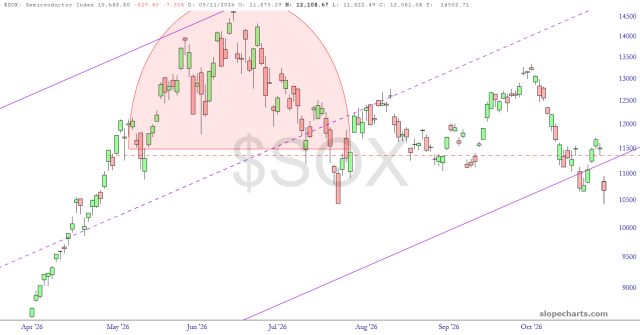
Few sectors have taken a hard fall as semiconductors did in October. It plunged hard enough to finally crack under its lengthy price channel.
The S&P 500 pattern is virtually identical to that of the S&P 100. The measured move for this pattern takes it to 7380.
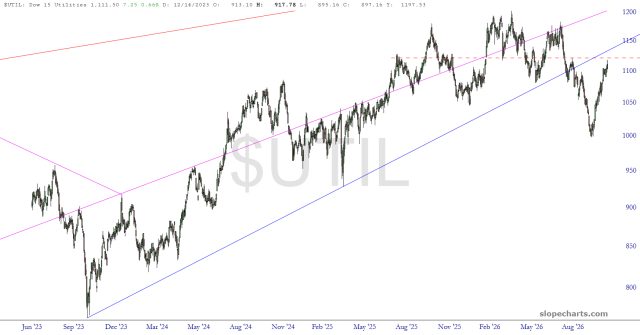
The move higher in October for the Dow Utilities was tremendous, but I think it’s just about done. Take note of where the price is relative to the broken trendline.
This upcoming Wednesday is going to be crucial because the reaction to the election could be instrumental in creating a more substantial price failure.



Comments
Log in or sign up to join the conversation.