

Good Monday morning and welcome back. Apparently all it took was one utterance of the word “phenomenal” by Mr. Trump in order to remind traders that tax reform hasn’t been forgotten and that the plan is likely to be pro-business. Since the President used one of his signature adjectives to tease the administration’s upcoming tax plan, the market has stepped lively to new highs. As such, it looks like the bull train is rolling again. But before I digress into any additional subjective analysis, let’s hit pause and move on to our weekly review of the key models and indicators.
The State of the Trend
We start each week with a look at the “state of the trend” from our objective indicator panel. These indicators are designed to give us a feel for the overall health of the current short- and intermediate-term trend models.
(Click on image to enlarge)
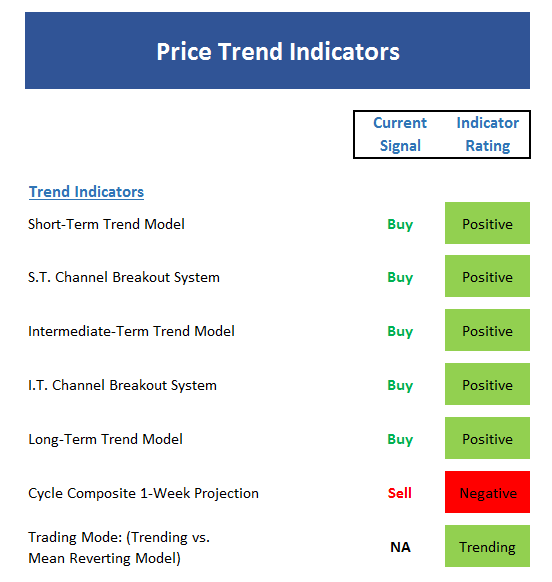
Executive Summary:
- There’s a lot of green on this board
- But frankly, this is what you’d expect with the major indices at all-time highs
- The lone holdout is the cycle composite
- The cycles project a pullback for the next couple of weeks
- Our Trading Mode models are now all singing the same song
- One of our Channel systems suggests that the 39-day weighted MA is the trend-following indicator to watch right now
The State of Internal Momentum
Now we turn to the momentum indicators…
(Click on image to enlarge)
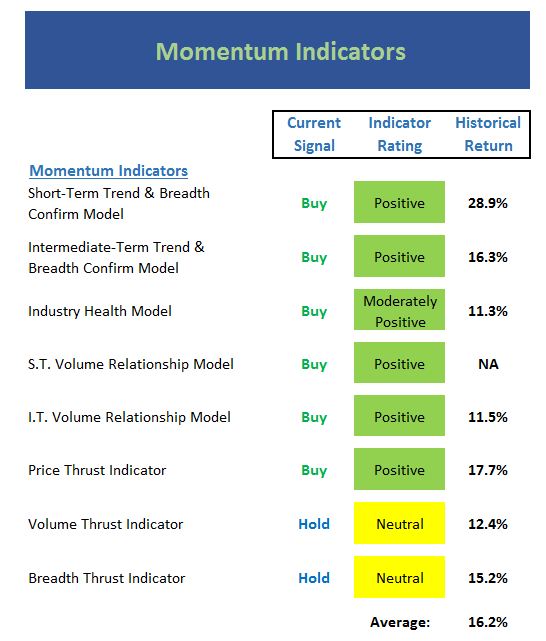
Executive Summary:
- Not much to complain about here either
- But, the Industry Health model has yet to move into the purely positive zone – and as I’ve been saying for eons, I’d like to see this model confirm the bull move
- The Price Thrust model has crept up into the positive zone
- However, both the Volume and Breadth Thrust indicators remain neutral
- These should turn green soon if a significant move is underway
The State of the “Trade”
Next up is the “early warning” board, which is designed to indicate when traders may start to “go the other way” — for a trade.
(Click on image to enlarge)
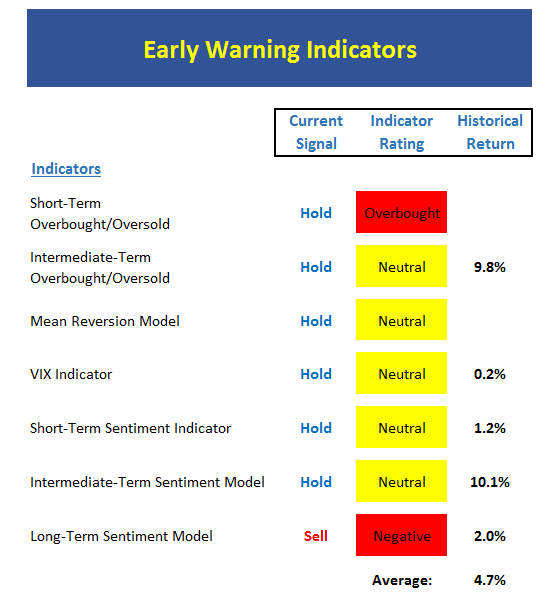
Executive Summary:
- While the short-term price indicator remains in overbought territory, other short-term indicators are only neutral
- The Intermediate-term Overbought/Sold indicator has moved back into neutral territory, which argues the recent overbought condition has been alleviated
- The Mean Reversion model, which issued a buy signal last week, is now moving back to cash at Monday’s close. Not a bad trade.
- The Short-Term Sentiment Indicator moved back to neutral last week
- As did the Intermediate-Term indicator
- The recent changes on this board suggest that the bears missed their opportunity to capitalize on the combination of an overbought condition and overly optimistic sentiment
The State of the Macro Picture
Now let’s move on to the market’s “external factors” – the indicators designed to tell us the state of the big-picture market drivers including monetary conditions, the economy, inflation, and valuations.
(Click on image to enlarge)
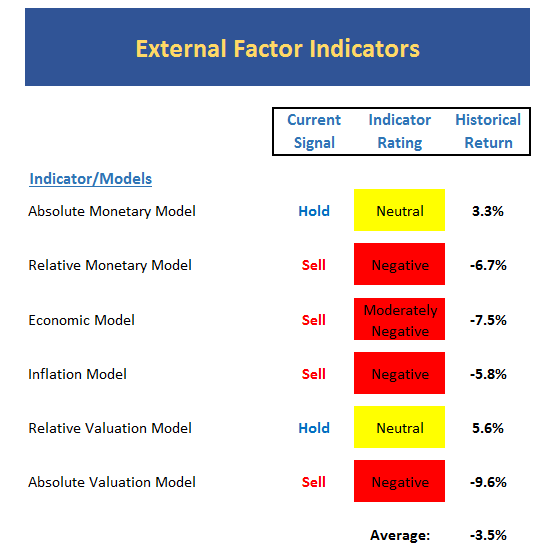
Executive Summary:
- The “quick take” on this board remains worrisome
- The Absolute Monetary Model reading continues to fall
- The Economic Model (designed to call stocks) upticked out of the negative zone this week
- The Economic Model designed to call the economy remains in “strong growth” mode
- The Inflation models continue to warn that inflation is on the rise
- The Relative Valuation Model, which recently turned neutral, had been positive since early 2010
The State of the Big-Picture Market Models
Finally, let’s review our favorite big-picture market models, which are designed to tell us which team is in control of the prevailing major trend.
(Click on image to enlarge)
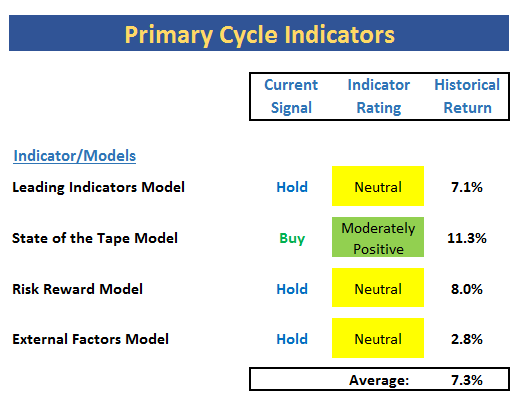
Executive Summary:
- The “quick take” on this board suggests that this is not a low-risk environment
- The average of the historical returns is below the long-term average for the stock market
- While the color didn’t change, the Risk/Reward Model did uptick to high neutral last week
- The External Factors Model continues to struggle with the recent spike in interest rates and the fact that monetary policy is becoming less friendly – at least from an historical perspective
The Takeaway…
While the use of the words, “Yea, but…” tends to get one in trouble in this business, I do believe that the warnings being issued by many of the monetary and external factor models currently may need to be tempered. As we’ve discussed, the Fed is NOT trying to slow inflation or the economy at this time – just the opposite. And since central bankers have gone to extreme measures in an effort to try and move the needle on both inflation and economic growth, the fact that the Fed is attempting to return to a more normal policy stance does not appear to be as negative as the indicators are suggesting at this time. As such, the indicator boards – especially the longer-term, big-picture modes – may be too negative here. But just in case my subjective read may miss the mark, we will continue to monitor the models and watch the action fairly closely.
Thought For The Day:
“I really wish I was less of a thinking man and more of a fool not afraid of rejection.” – Billy Joel
Current Market Drivers
We strive to identify the driving forces behind the market action on a daily basis. The thinking is that if we can both identify and understand why stocks are doing what they are doing on a short-term basis; we are not likely to be surprised/blind-sided by a big move. Listed below are what we believe to be the driving forces of the current market (Listed in order of importance).
1. The State of Trump Administration Policies
2. The State of the U.S. Economy
3. The State of Global Central Bank Policies



Comments
Log in or sign up to join the conversation.