


WHEAT
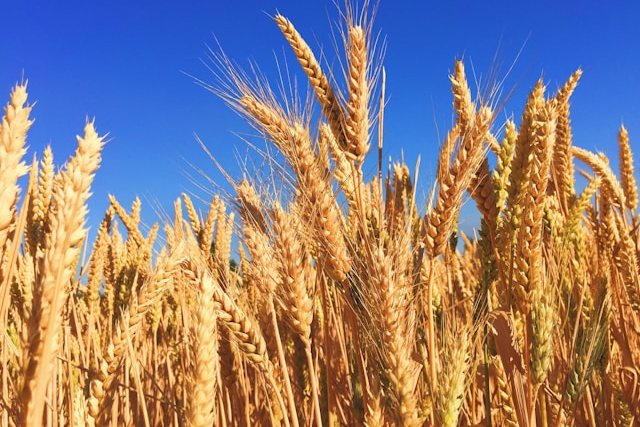
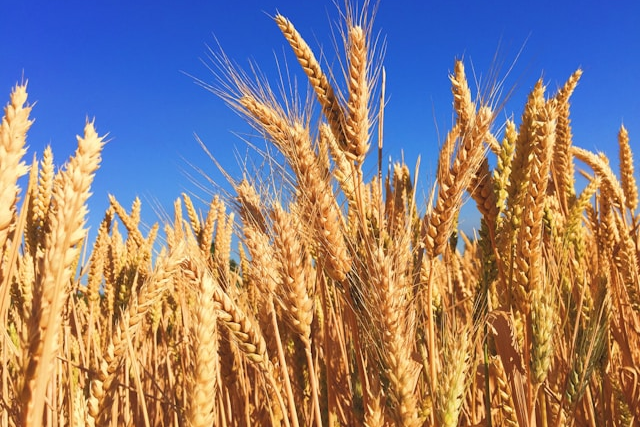
General Comments: Wheat closed higher in both markets last week as the rally tied to the USDA reports and world weather fund new footing. The harvest continues and harvest yield reports remain low. USDA said that Winter Wheat production is below the previous estimat3e at 990 million bushels. Spring Wheat production was estimated higher at 475 million bushels and Durum production was decreased to 71 million bushels. All Wheat production was higher at 1.536 billion bushels. Wheat stocks were 920 million bushels for 2025-26 and 722 million bushels for 2026-27. The crop condition ratings are still among the lowest in over 30 years in HRW areas and have provided some support for prices. Conditions are good in the US Midwest, but Europe has been too hot. The weather is now featuring scattered showers for parts of the Midwest along with cooler temperatures.
Chart Analysis: Trends in Chicago are up. Support is at 626, 621, and 602 September, with resistance at 660, 674, and 692 September. Trends in Kansas City are up. Support is at 659, 639, and 627 September, with resistance at 692, 708, and 729 September. Trends in Minneapolis are not available.
RICE
General Comments: Rice closed higher last week in renewed buying. USDA said that Rice planted area is estimated at 2.017 million acres and harvested area is estimated at 1.979 million acres. Long grain planted area is 1.395 million acres and harvested area is 1.375 million. Yield was increased, but production was cut to 153.3 million cwt and ending stocks were reduced to 30.09 million cwt for All Rice. Emergence is about average, and condition was slightly improved from last week. Demand remains moderate to poor for US Rice and was moderate to poor last week.
Chart Analysis: Trends are mixed. Support is at 1340, 1292, and 1268 September and resistance is at 1404, 1416, and 1428 September.
CORN AND OATS
General Comments: Corn was higher last week ss the rally tied to too much rain in many Midwest growing areas and hot and dry weather in Europe continued to fizzle out. USDA showed that stocks were less than trade expectations at 2.020 billion bushels for the current year and 1.790 billion for the coming year on increased feed demand for the current year and increased export demand for the coming year. Corn planted area was estimated at 95.343 million acres and that harvested area is estimated at 87.4 million acres. It should be cool with showers around this week. The crop conditions are strong but below aa year ago. Forecasts for good growing conditions continue in the Midwest. Silking is starting. Temperatures in the Midwest should be cool for the next week. Oats were higher last week and trends are up on the weekly charts, and are up on the daily charts. Oats ending stocks were increased by 6 million bushels to 32 million.
Chart Analysis: Trends in Corn are up. Support is at 406, 404, and 401 September, and resistance is at 454, 459, and 465 September. Trends in Oats are up. Support is at 328, 318, and 307 September, and resistance is at 361, 364, and 370 September.
SOYBEANS
General Comments: Soybeans and the products were higher on a the rally tied to the USDA reports on reports of improved conditions in the Midwest and new China demand news. Soybeans stocks were estimated at330 million bushels for the current year and 310 million for the next year and are below trade estimates. Rapid planting and emergence progress was shown by USDA this week and reports of good conditions continue. Condition is rated high by USDA in the latest reports. Futures were also higher of news of China demand. Cooler temperatures and wet weather are expected for the next week in the Midwest. There is talk that more Soybeans could be planted as Corn planting is more expensive. The big South American harvests are also weighing on prices.
Overnight News: USDA confirmed sales of 136,000 tons of US Soybeans to China.
Analysis: Trends in Soybeans are up. Support is at 1163, 1154, and 1149 August, and resistance is at 1208, 1220, and 1232 August. Trends in Soybean Meal are up. Support is at 315.00, 309.00, and 305.00 August, and resistance is at 325.00, 329.00,and 333.00 August. Trends in Soybean Oil are mixed. Support is at 6540, 6440, and 6320 August, with resistance at 7310, 7460, and 7580 August.

Comments
Log in or sign up to join the conversation.