

Gold price moved sideways last year, despite inflation ravaging the developed world. A traditional hedge against inflation, the yellow metal failed to do so in 2021. What will 2022 bring?
2021 has been a tough year for gold investors. Those accumulating gold throughout the years to protect from rising inflation were disappointed to see that gold failed to do so.
Inflation rose everywhere in the developed world, but gold did nothing to act as a hedge against the rise in the prices of goods and services. Just the opposite – it underperformed and delivered a negative return on the year.
However, a deep look under the surface reveals a potentially bullish setup for gold. Here are four reasons why the yellow metal might enhance the portfolio’s performance in 2022:
- Strong gold demand in 2021
- Gold bar and coin investment in 2021 have reached an eight-year high
- Central banks accumulated gold last year
- The technical picture shows a potential bullish contracting triangle
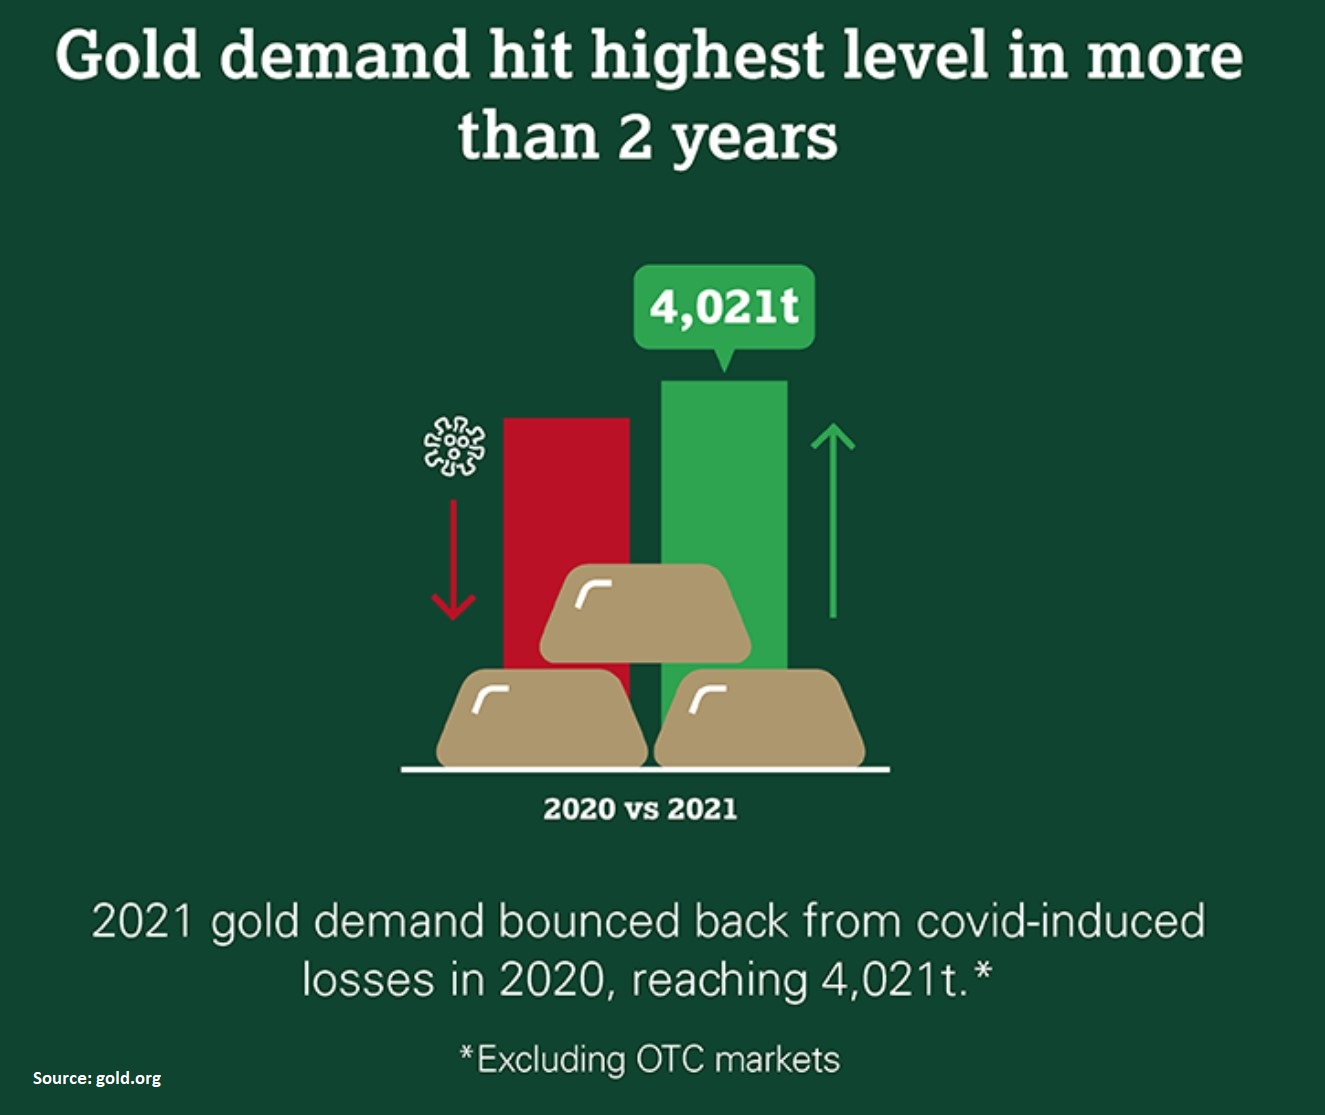
Strong gold demand
In 2021, gold demand hit the highest level in more than two years. If we exclude the OTC markets, gold demand reached 4,021 t.
Gold bar and coin investment are on the rise
Investment in physical gold reached an eight-year high in 2021. There are various forms of investing in gold, such as buying paper gold (i.e., gold ETFs), shares in a gold mining company that pays a hefty dividend or simply investing in the physical metal.
The latter translates into buying gold bars and coins, and the demand reached record annual levels in the United States and Germany last year. Naturally, inflation concerns were a key driver.
Central banks buy gold in a frenzy
2021 was when the central bank’s buying of gold rose 82% compared to the previous year. Central banks from both developed and emerging markets have added gold to their reserves.
Gold consolidates in a possibly bullish pattern
Finally, the long-term consolidation in the gold price looks like a bullish triangular pattern. It started right after gold made an all-time high in 2020, and then a series of lower highs and higher lows followed.
(Click on image to enlarge)
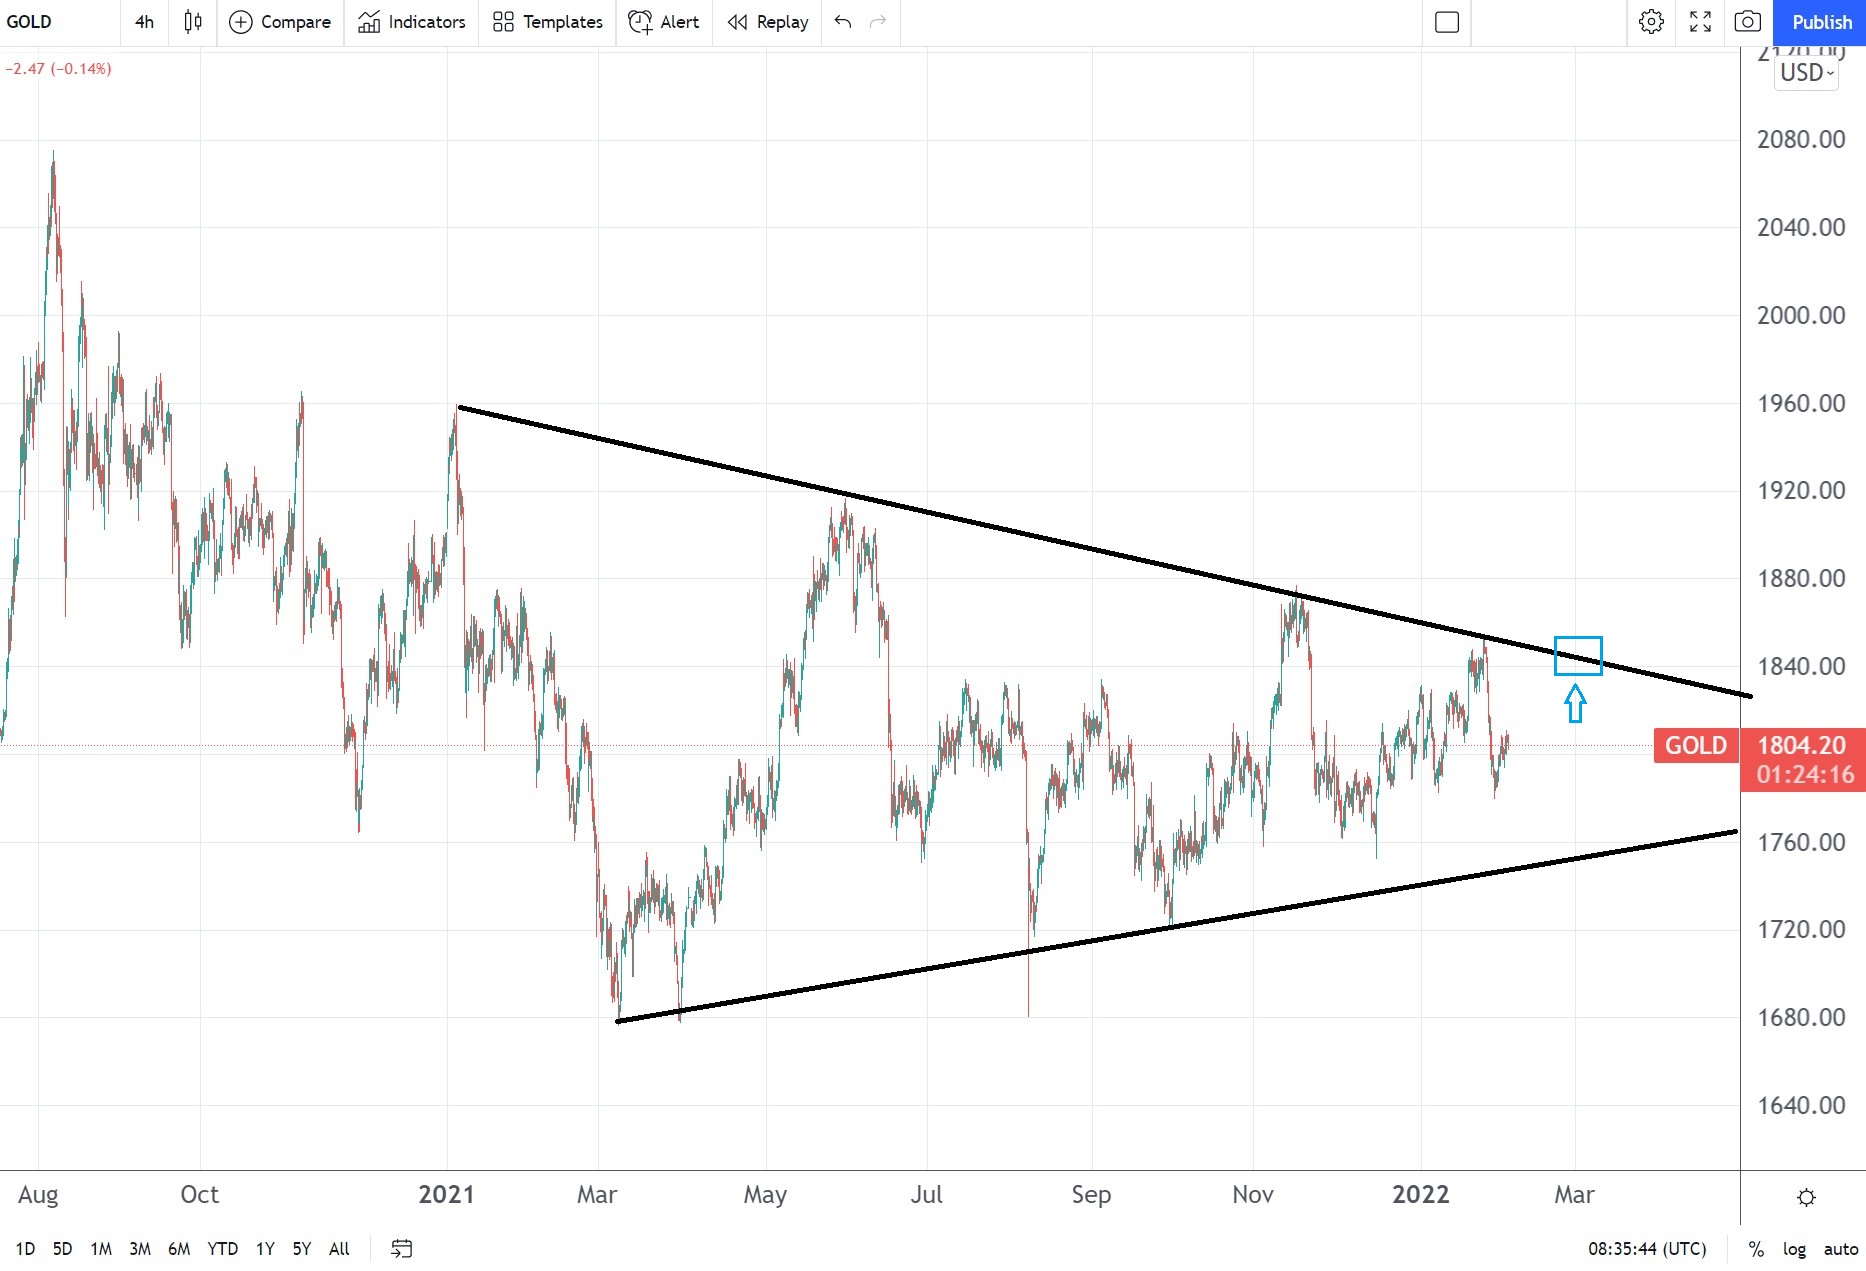
The triangle is also visible on the large timeframes, and a break above $1,880 should trigger more upside.


Comments
Log in or sign up to join the conversation.