


In this technical blog, we’ll take a closer look at our Elliott Wave charts for the Google Stock (GOOGL). We identified incomplete bearish sequences within the cycle from the 384.57 peak, calling for further downside. In the following analysis, we’ll review the Elliott Wave structure and see how the market followed our outlook.
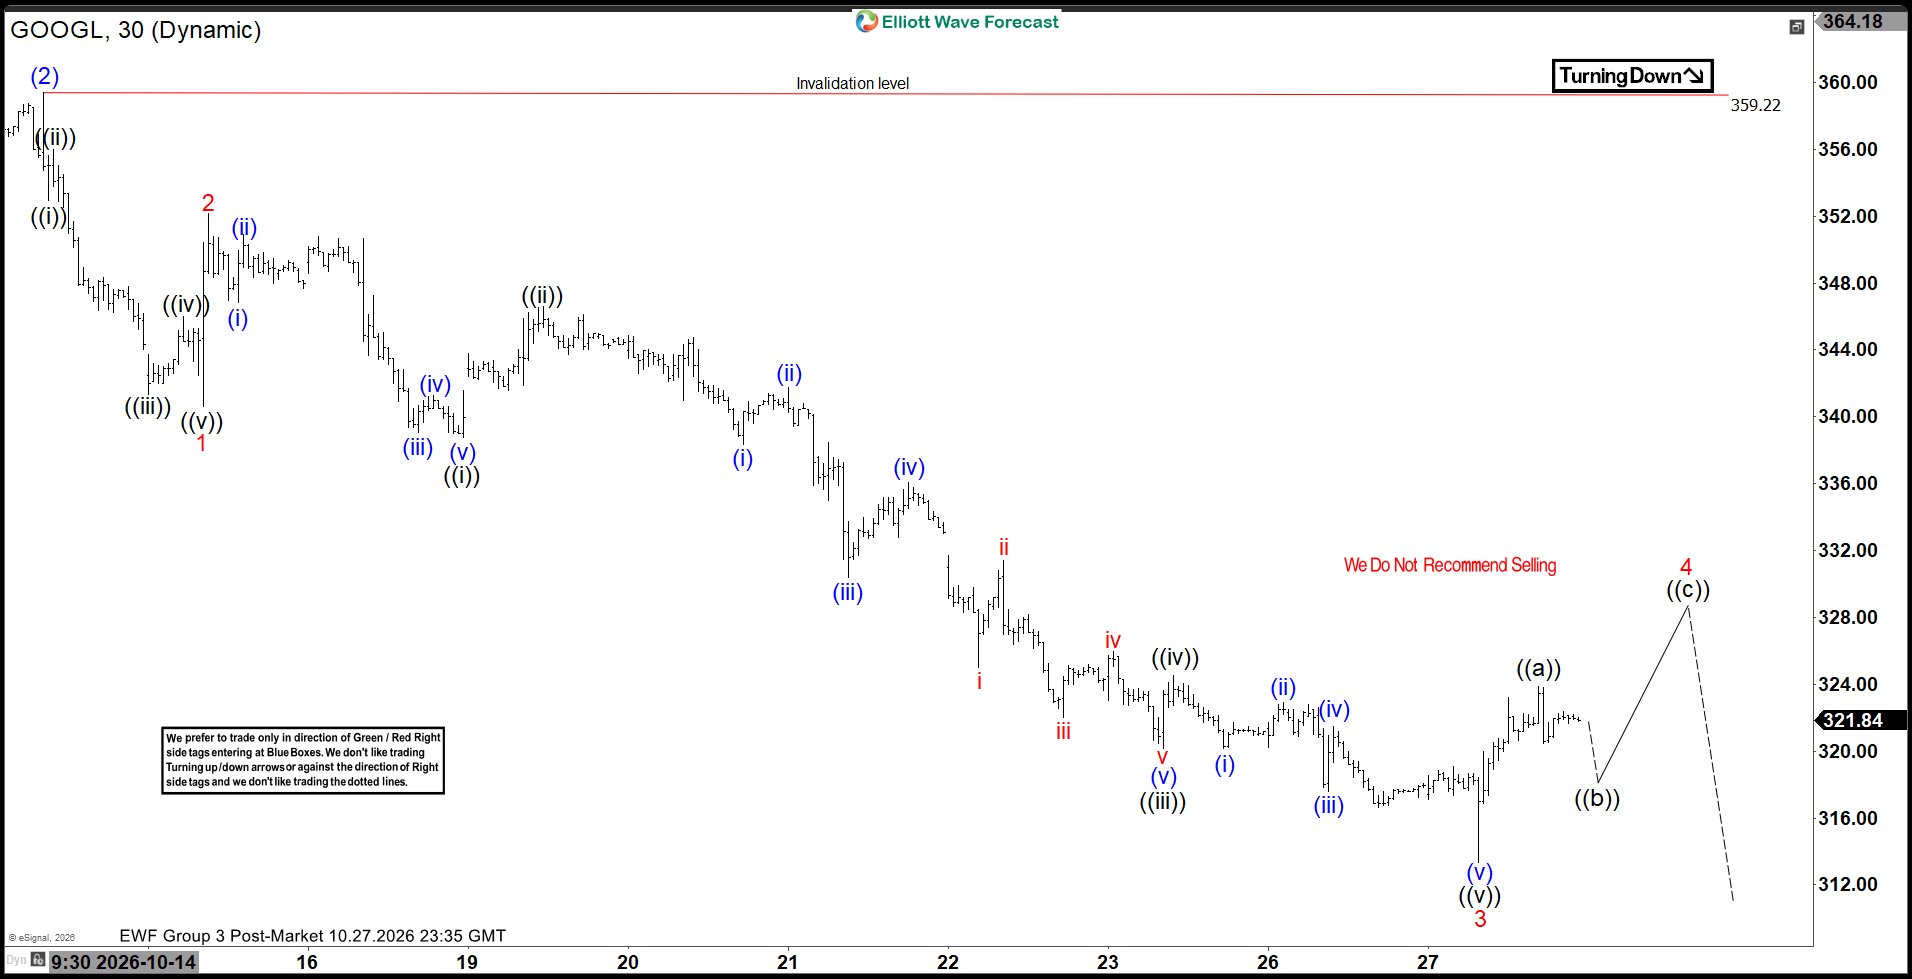
Google Elliott Wave 1-Hour Chart 10.27.2026
Google Stock developed bearish impulsive sequences in the cycle from the 359.22 peak. Our analysis indicated that the cycle was still in progress, with price entering a wave 4 recovery. Since wave 4 corrections are typically shallow, we anticipated a potential bounce toward the 23.6%–38.2% Fibonacci retracement zone of wave 2, which came at 322.77–328.44. We did not recommend buying at that stage and instead favored the short side.
It is important to understand that we do not use Elliott Wave analysis in isolation. We combine it with cycle and market correlation analysis, looking at multiple time frames to build a clearer picture of the market.
While the H1 chart showed a developing bearish 5-wave pattern, our analysis was primarily driven by the H4 structure. The cycle from the 384.57 peak showed incomplete bearish sequences, projecting further downside toward the 306.98–271.66 target area.
By combining Elliott Wave analysis, cycle analysis, and multiple time frames, we were able to anticipate the bearish continuation and identify the downside target zone in advance.
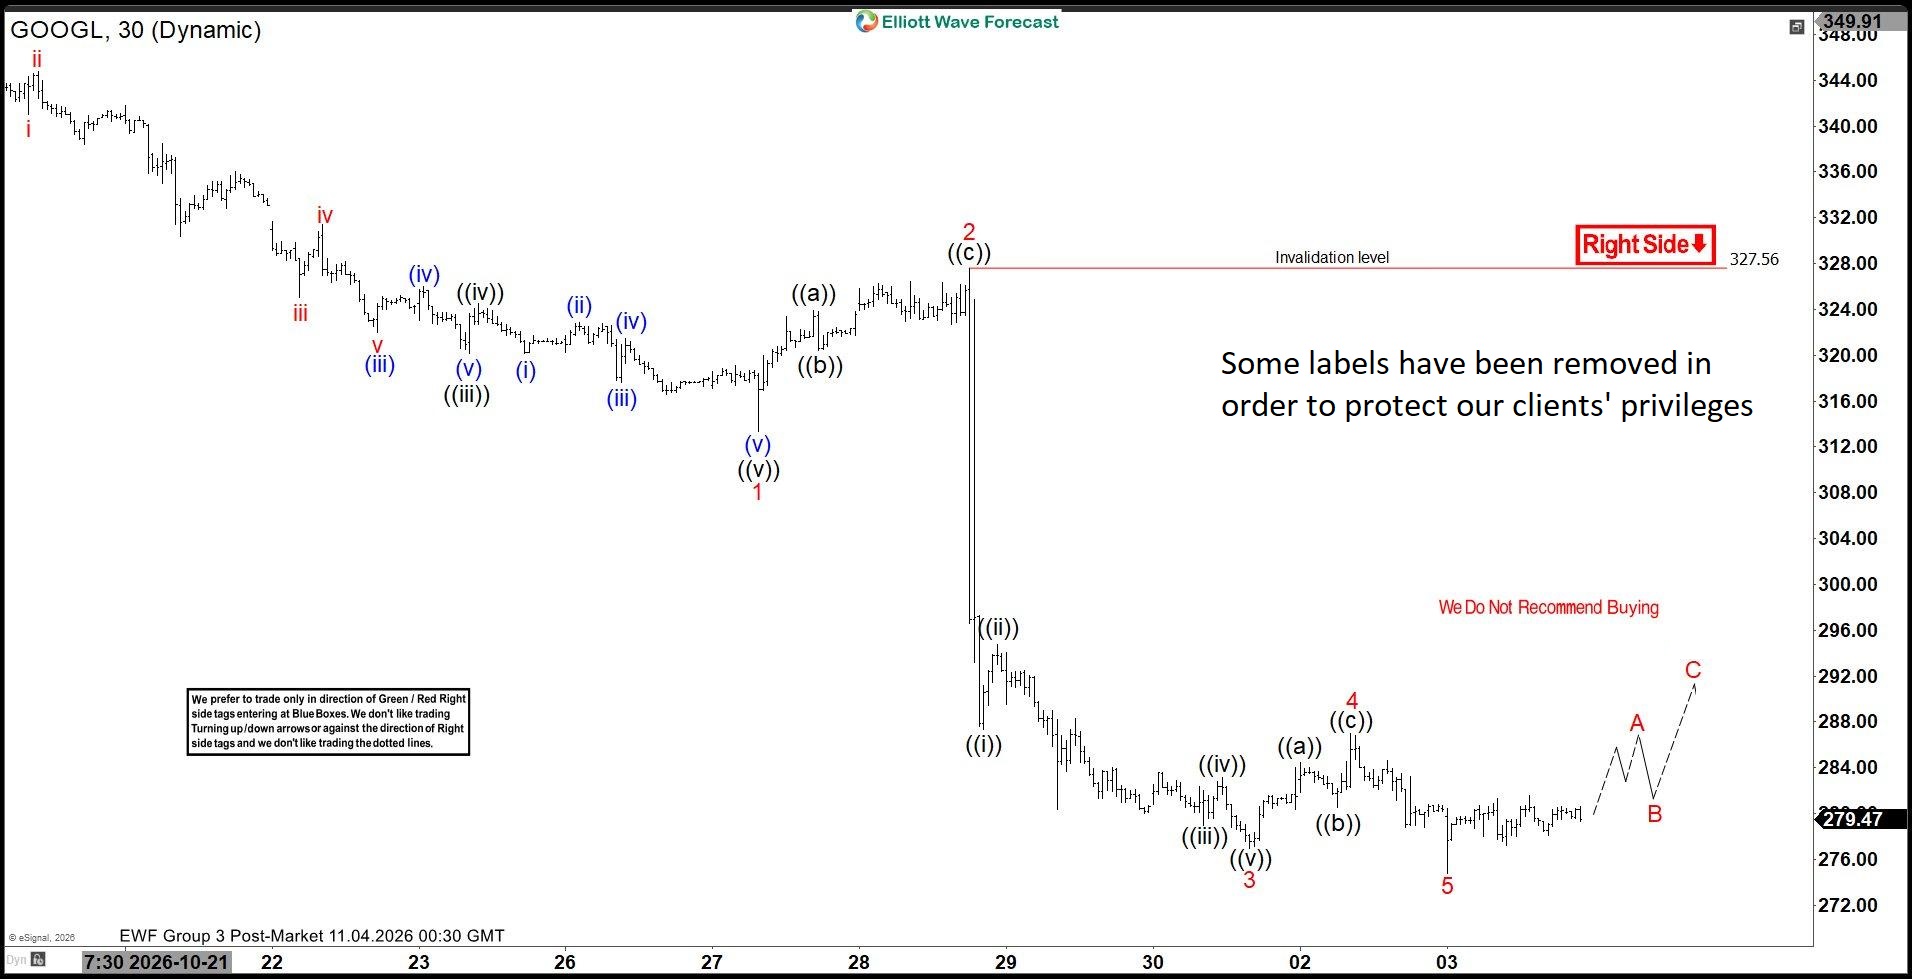
Google Elliott Wave 1-Hour Chart 11.04.2026
The stock completed a 3-wave bounce before turning sharply lower and breaking to new lows. Once again, incomplete bearish sequences accurately projected the market's path. Price has now reached our previously identified target area of 306.98–271.66, where the cycle from the 384.57 peak could be nearing completion.


Comments
Log in or sign up to join the conversation.