

The GOOG stock (Alphabet/Google) has been in a very strong bullish trend. The uptrend is valid since price action made a deep dip in March 2020 because of the COVID 19 pandemic.
Currently, the price action is showing another pause. Is the chart ready for a reversal or will the uptrend persist?
Price Charts and Technical Analysis
(Click on image to enlarge)
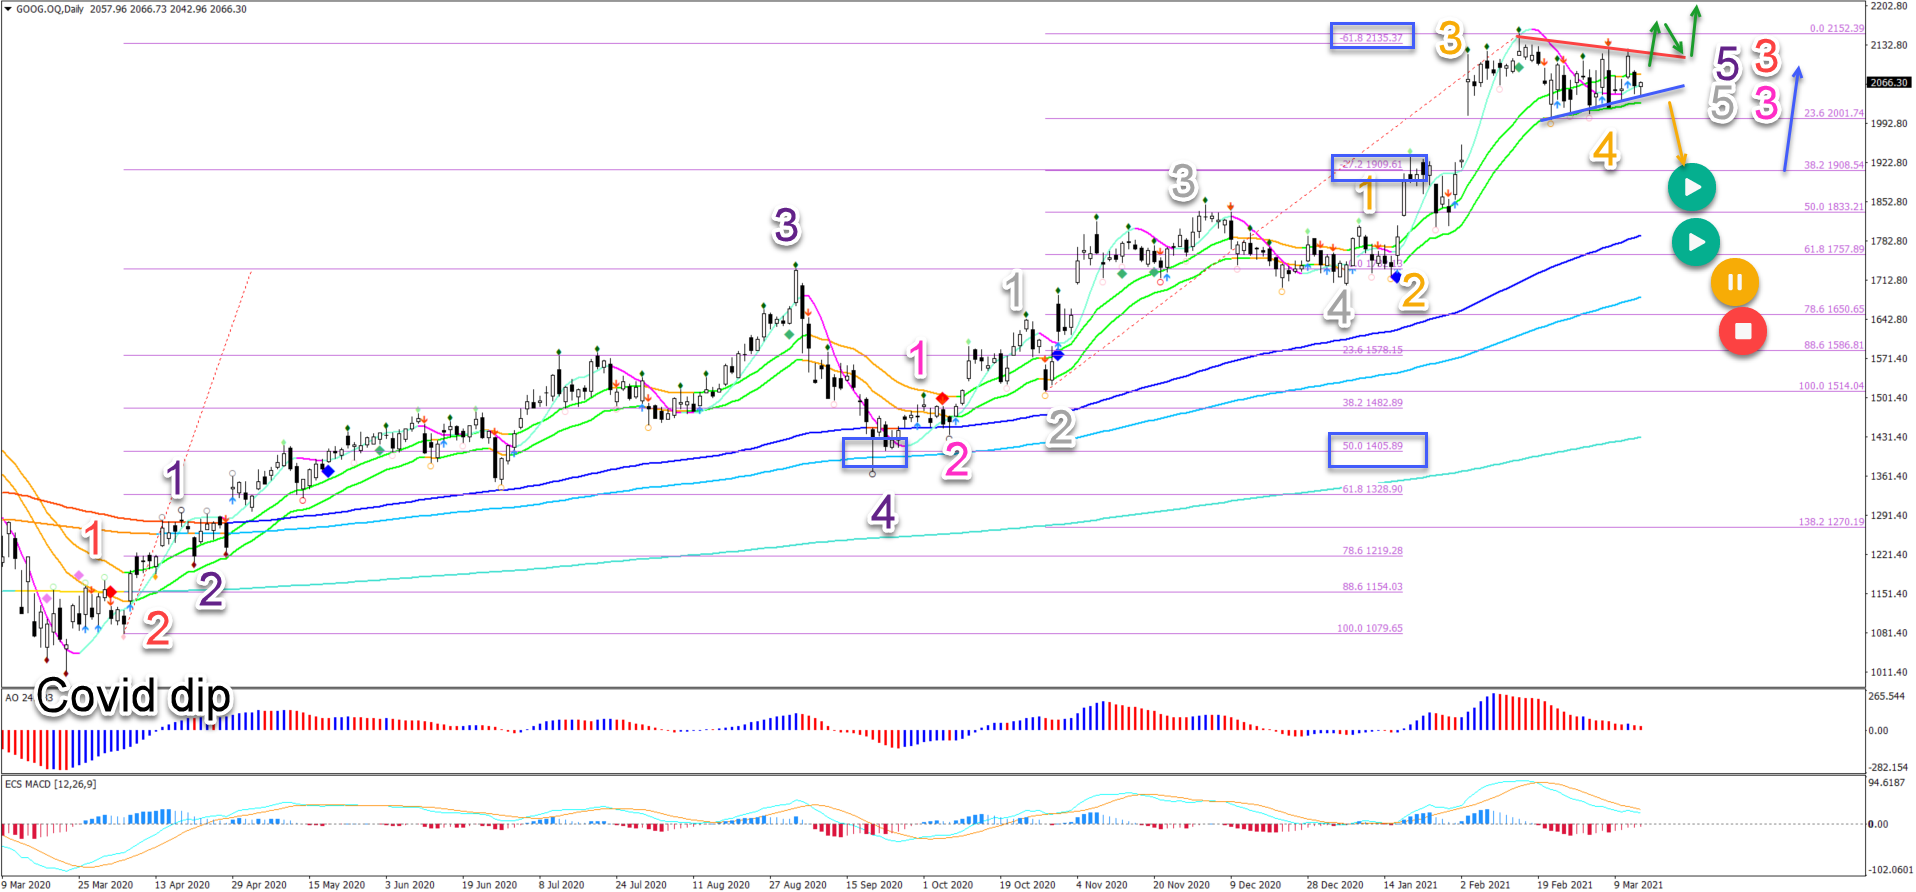
The GOOG stock is building a consolidation zone at the 21 ema support zone.
The 21 EMAs have been strong support ever since price action made a dip one year ago – with the exception of the pullback during September 2020. Let’s review:
- The consolidation zone is probably a wave 4 correction (orange).
- Waves 4 usually respect shallow Fibonacci levels like the 23.6%, 38.2%, or max 50% Fib.
- A bullish breakout (green arrows) indicates an immediate uptrend continuation within wave 5 (grey) within wave 3 (pink).
- The next target is located at the round level of $2,250.
- A bearish breakout (orange arrow) indicates a deeper pullback. The main target is the 38.2% Fib.
- The 38.2% or 50% is likely to act as support and send price action up again (blue arrow) within the larger uptrend.
- Only a break below the 61.8% Fib places the uptrend on hold (yellow circle).
- Whereas a very deep pullback invalidates the current uptrend (red circle).
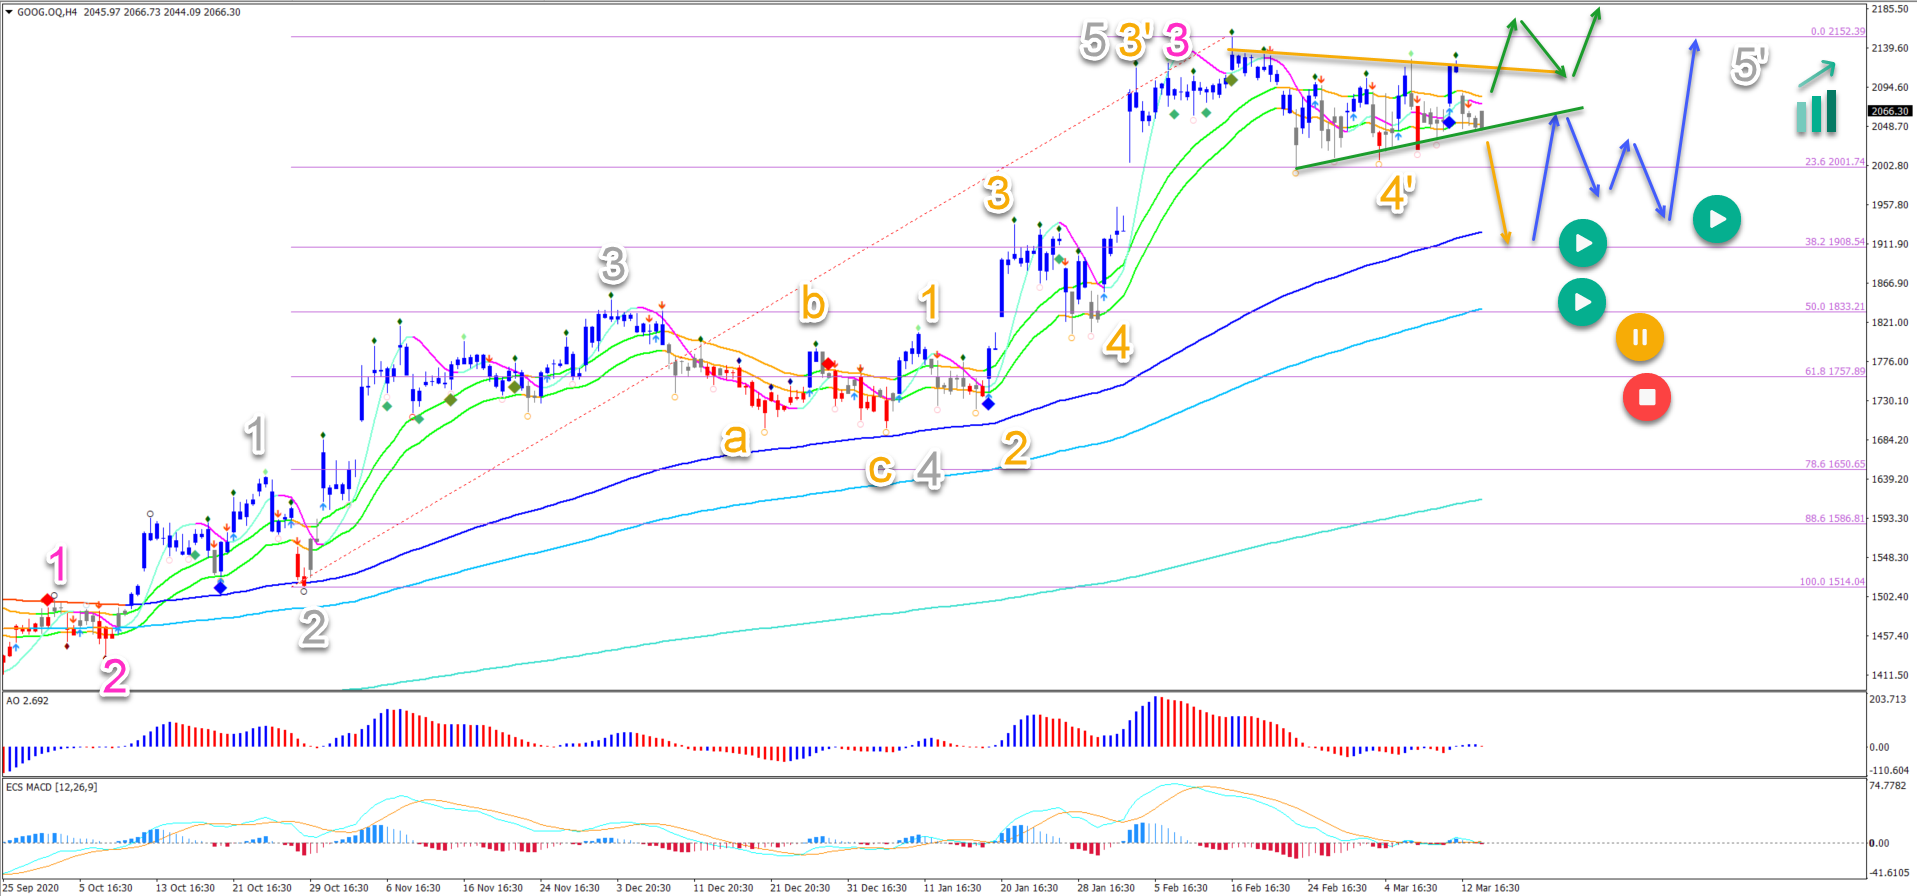
On the 4 hour chart, there are two wave variants added.
One shows a wave 1-5 (orange) completed at the recent high within wave 5 (grey) in wave 3 (pink). The other scenario is that price is now in a wave 4’ (orange) pullback.
In any case, price action is expected to either make a bullish breakout (green arrows) or build a pullback towards the Fibonacci levels (orange arrow) and bounce (blue arrow).
(Click on image to enlarge)



Comments
Log in or sign up to join the conversation.