


Quick answer
On September 17, 2022, our weekly Gold chart marked a Blue Box buying zone at $1,668 to $1,421. Gold bottomed inside it at $1,615, held a second test in November, and rallied to a peak of $5,598.75 in early 2026, about 236% from the top of the box and 247% from the low.
Key question: Did Gold’s multi-year run start inside a Blue Box that was published before the low?
Key Takeaways
September 17, 2022 weekly Gold chart: Blue Box $1,668–$1,421 while price was near $1,674.
Structure view: three-swing ((A))-((B))-((C)) pullback inside a larger bullish cycle, not a new secular bear by default.
Low printed near $1,615 inside the zone; second test held in early November 2022; price has not revisited the box since.
Peak $5,598.75 in early 2026: about +236% from the top of the box, +247% from the low; Oct 24, 2026 weekly near $3,995 still about +139% from $1,668.
Labels can be refined later; the zone and invalidation ($1,041.60 / 2015 low) did the risk job. This is educational, not a profit guarantee.
Gold is the market everyone wants to talk about. From its 2022 low it more than tripled to a peak of $5,598.75 in early 2026, and it still trades near $4,000.
Here is the whole run on our weekly chart, as it stands on the October 24, 2026 update.
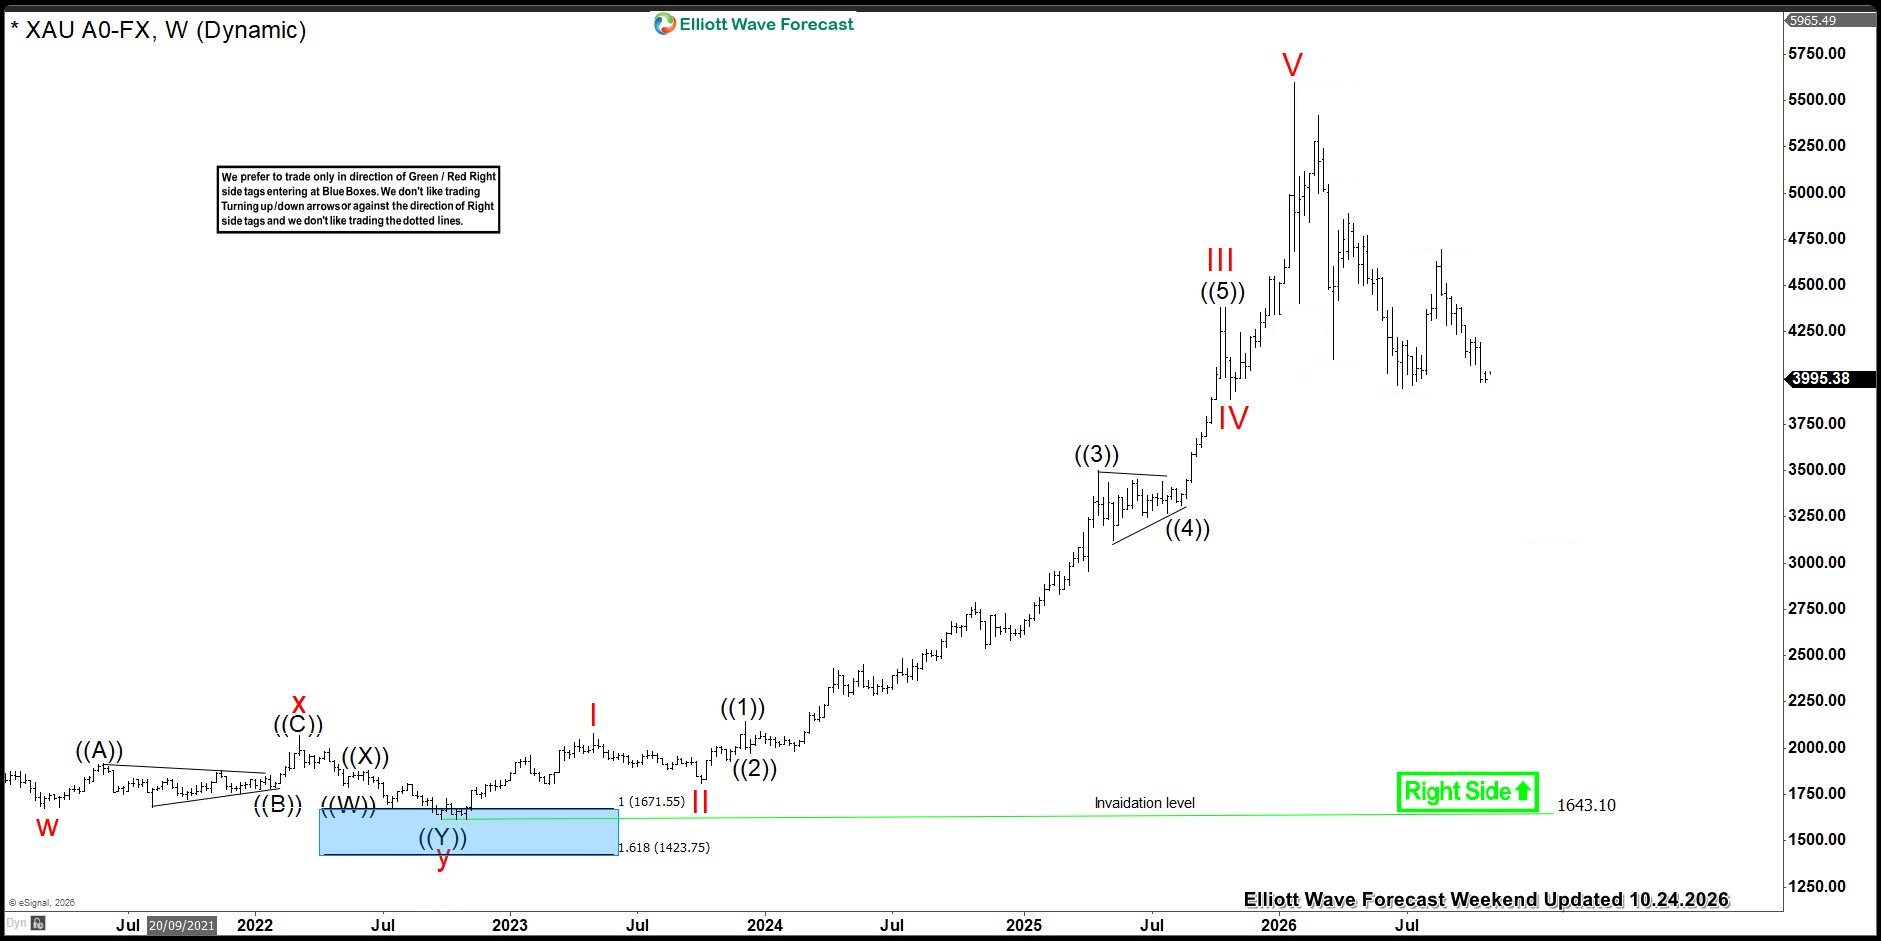
Today: Gold weekly chart, October 24, 2026. Look at the bottom-left corner of the path from the 2022 low. Source: Elliott Wave Forecast.
Now look at the bottom-left corner. See that blue rectangle under the 2022 low?
That is where this run began. And we drew it before price got there.
Now Everyone Is a Gold Expert
Every financial channel has a gold segment. Every feed has a gold chart. The pundits who ignored gold for years now argue about whether the bull market is finished.
That is a fair question. It is also four years late.
Wouldn’t it have been useful to see this run framed before it started, when few wanted gold at all?
What We Showed in September 2022
Rewind to September 2022. The Fed was hiking in 75-basis-point steps, the US dollar was at a multi-decade high, and inflation was above 8%. Gold, the “inflation hedge,” was falling week after week. Consensus said the 2020 high had been the top.
On September 17, 2022, with gold near $1,674, we published this weekly chart.
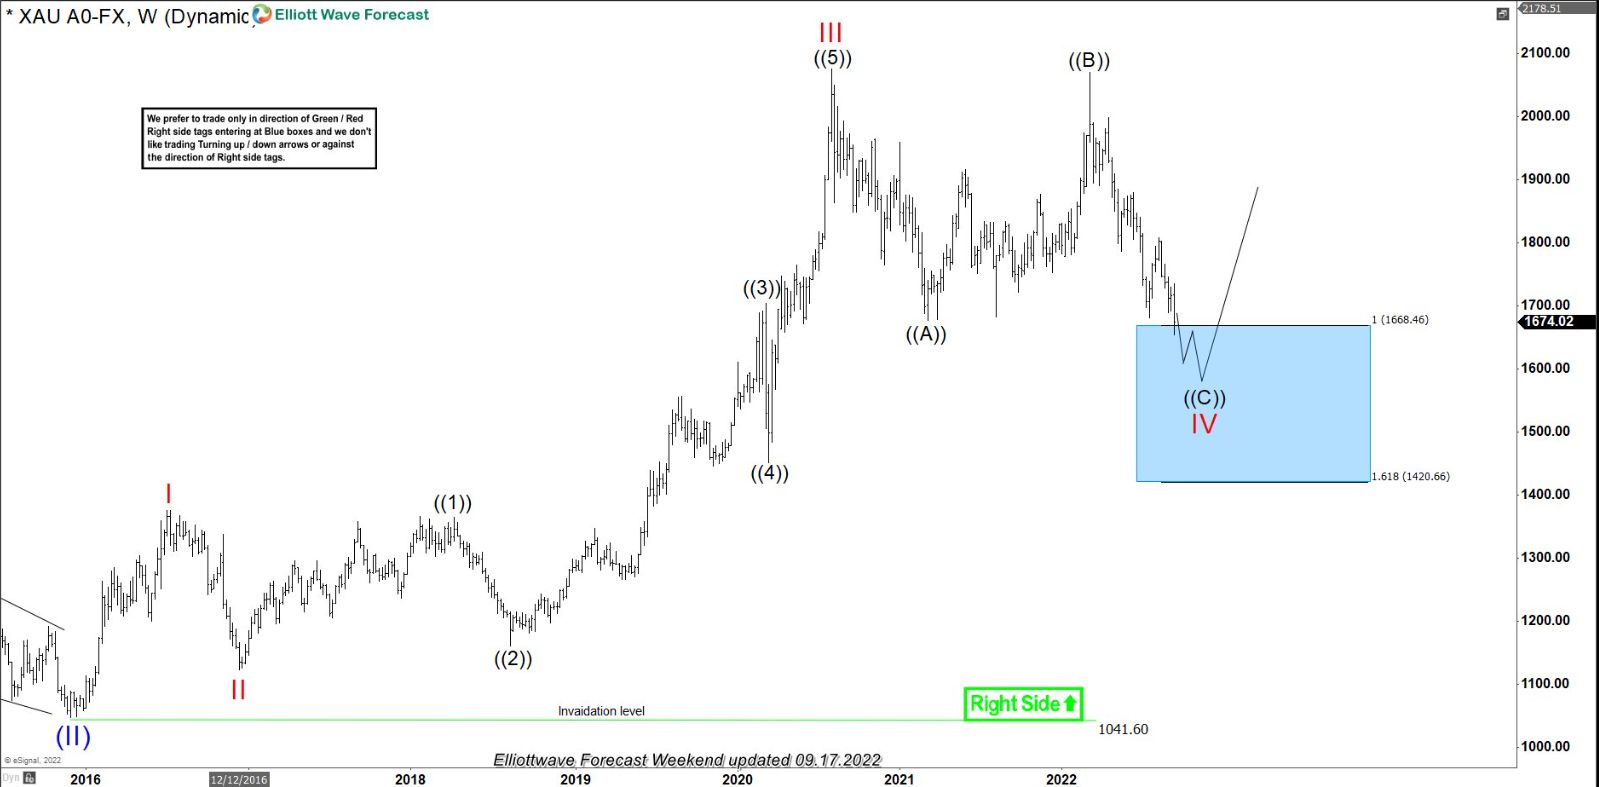
Then: Gold weekly chart, September 17, 2022, before the low. Blue Box marked $1,668 to $1,421. Source: Elliott Wave Forecast weekend update.
Published | September 17, 2022, weekly chart |
|---|---|
Instrument | Gold (XAUUSD) |
Price that day | About $1,674 |
Structure | Three-swing ((A))-((B))-((C)) pullback inside a bullish cycle |
Blue Box | $1,668 to $1,421 |
Expected reaction | Buyers in the zone; preferred path was for the larger uptrend to resume |
Invalidation | $1,041.60, the 2015 low |
While headlines treated the decline as the start of a bear market, the chart treated it as a correction inside a bullish cycle, with the buy zone mapped and the risk line clear. For the rule base behind impulse vs correction and reaction zones, see our Elliott Wave Theory guide. For more honest before/after cases (including setups that failed at invalidation), see Does Elliott Wave Actually Work?.
Gold was only a few dollars above the box. Days later it was inside it. It made a low near $1,615 in late September, tested the zone again in early November, held, and turned up. It has not been back since.
What It Meant
Result | Played out |
|---|---|
Low | $1,615, inside the zone (late September 2022), retested in early November |
Reaction | Rally from the zone; price never returned to the box |
Peak | $5,598.75, early 2026 |
Move from top of the box ($1,668) | +236% to the peak |
Move from the low ($1,615) | +247% to the peak |
Latest (October 24, 2026) | $3,995, still +139% from the top of the box |
Our wave labels have been refined since 2022: that low is now counted as the end of a larger, deeper correction, and the rally since as a new five-wave cycle. Labels evolve as structure develops. The zone did its job. Complex corrections can also show up as WXY vs simple ABC paths on other instruments; the point is the same: map the zone, define risk, update when price proves you wrong.
What Would You Have Done With This Chart?
Put yourself back in September 2022. Bonds had a brutal year, and long-dated bonds kept sliding into late 2023 as yields rose. Cash and savings were losing ground to high inflation. Headlines said gold was dead.
Now imagine you had this chart open, with a buy zone marked and a clear line where the idea would be wrong. What would you have considered?
Moved part of fixed income into gold? Shifted a slice of bonds or fixed deposits out of an asset class that was falling as rates rose, into one sitting at a mapped buy zone.
Bought gold coins? 1 oz coins near the top of the box and held for the cycle.
Bought gold bars? Physical bullion at prices gold has not revisited.
Bought gold in a trading account? Spot, futures, or a gold ETF, with risk defined relative to the zone and invalidation.
The $10,000 question (hypothetical)
Moved into gold at the top of the Blue Box, $1,668 | $10,000 ≈ 6 oz |
Value at the $5,598.75 peak | ≈ $33,600 |
Value with gold near $4,000 (Oct 2026 context) | ≈ $24,000 |
Hypothetical illustration before dealer premiums, storage, commissions, and taxes. Not a recommendation.
The hard part was never the arithmetic. It was acting while every headline said the opposite.
So which would you rather have been reading in September 2022: the headlines, or this chart?
XAUUSD
● Live for members
Where Does Gold Go Next?
Gold has pulled back from its $5,598.75 peak, and the crowd is asking whether the run is over. Another Blue Box is setting up in Gold. Members already have the next zones mapped. Access it before price reaches the next blue box.
Level | This article | Members' area |
|---|---|---|
Next Blue Box | Not shown | 8,888.88-8,888.88 |
Current wave | Not shown | ((x)) of (y) |
Target area | Not shown | 8,888.88-8,888.88 |
Invalidation level | Not shown | 8,888.88 |
Next swing move | Not shown | Up in ((z)) |
14-Day Trial$0.99About 7¢ a day · Cancel anytime
Start My 14-Day Trial for $0.99 →
FAQ: Gold Blue Box 2022
What is a Blue Box in Elliott Wave Forecast charts?
A Blue Box is a Fibonacci reaction zone where the desk expects buyers or sellers to defend a preferred wave path. On the September 17, 2022 Gold weekly chart, the Blue Box buying zone was $1,668 to $1,421, measured as the 100% to 161.8% extension of the ((A)) leg from ((B)).
When did Elliott Wave Forecast mark the 2022 Gold Blue Box?
On September 17, 2022, with Gold near $1,674, the weekly chart marked a Blue Box from $1,668 to $1,421 and invalidation at the 2015 low of $1,041.60. Gold later bottomed inside the zone near $1,615.
How much did Gold rally from the 2022 Blue Box?
From the top of the box at $1,668, Gold reached a peak of $5,598.75 in early 2026, about +236%. From the $1,615 low inside the zone, the move was about +247%. As of the October 24, 2026 weekly chart, price near $3,995 was still about +139% from the top of the box.
Does a Blue Box guarantee Gold will bounce?
No. A Blue Box is a preferred reaction area with a defined invalidation. If price breaks the risk line, the count is revised. The 2022 Gold zone held; other setups can fail. Educational charts are not investment advice.



Comments
Log in or sign up to join the conversation.