
Summary
We had a volatile week last week, but it provided a huge opportunity for traders to take advantage of this collapse. Today, the market has met the targets for the daily signals. The market tested the $1,664 area, with $1,627 the low. Looking ahead, if the market closes above $1,654, it would activate the Sell 2 daily level of $1,665 and the weekly Sell 2 level for the rest of the week.
It may appear that the coronavirus caused the markets to collapse. A deeper analysis shows that the virus merely triggered a decline that has been building since 2008, as the central banks have increased debt to record levels around the world. However, whatever the real cause of the recent volatility - printing money or a spreading virus - the recent turmoil presents a major opportunity for traders. Without volatility, there are far fewer profits to be made. With the right tools, you can make some money.
Gold tested the $1,664 level. If the market closes above $1,654, it will activate the Sell 2 daily level of $1,665 and the weekly Sell 2 level at $1,736 for the rest of the week. If we close below $1,651, which is the weekly signal, it would negate this bullishness. If we close below $1,654, the daily Sell 1 level, it would negate this bullishness, and would also activate a bearish trigger. But first, let's look at the fundamentals and then we can delve more deeply into the technical analysis.
Fundamentals
In relation to Friday’s collapse in the marketplace, I don’t think it had anything to do with the coronavirus. The virus was the straw that broke the camel’s back. The panic that began took the bandage off what is really under this market; which is massive debt. It is the real problem that central banks have been nurturing since 2008. The virus was just the element that revealed this serious problem. We cannot afford higher interest rates. The virus has triggered devaluation and an implosion in the equity markets.
In metals, we are getting a reaction to what central bankers will have to do. They will have to lower interest rates substantially, which puts the entire financial system into a precarious situation. It is going to be very deflationary and recessionary. The world’s economies cannot afford to have this type of black swan.
Japan has been trying to come out of this almost-depression for 10 or 15 years, all with extremely low rates. Where are we going to go with interest rates when they reach zero? The real problem is that we cannot afford for interest rates to go up, nor can we afford economies to collapse.
The virus has disrupted the global economy, disrupted the supply chain, and it will only get worse. We published in the Associated Press just before the virus hit that gold is going to see deflation before inflation.
Our goal is to trade profitably. The key is to measure risk and handle it so you have success. The VC PMI is an algorithm that gives you definite entry points with clear probabilities. It tells you to buy at a certain level and the stop is at the level below, which provides immediate protection. The VC PMI also identifies the levels above as the targets. The mean is the first target and then the Sell 1 and 2 levels are the next targets.
Developments like the coronavirus or black swans do not, by definition, occur every day. Be prepared and try not to get caught up in the herd mentality or the emotion of the market.
Gold
Courtesy: TDAmeritrade
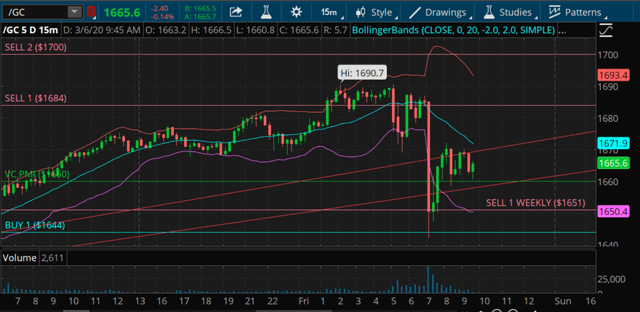
On the left of the chart are the daily VC PMI signals. We provide the signals to our subscribers the night before for the next day’s trading. We had a volatile week last week, but it provided a huge opportunity for traders to take advantage of this collapse. The coronavirus triggered the collapse, which is extremely bullish for the precious metals.
When the virus news came out, we exploded to $1,691.70. We did not know yet, then, what the damage would be to the global economy. When the virus news hit the market, it met some specific targets and gave the VC PMI the opportunity to tell our subscribers to lock in profits. The VC PMI is contrarian, in that it trades the extreme levels of supply and demand. The red levels in the chart represent an area of resistance. These are pivot points that have been activated by the VC PMI to show the extreme levels of supply and demand in red and blue.
Today, the market has met the targets for the daily signals. The market tested the $1,664 area, with $1,627 the low. When the market traded above the weekly average price of $1,608 on February 3, it activated a bullish trend momentum. The average price identifies the trend momentum, but the artificial intelligence recommends that, if you are not long, for day trading purposes, you wait for the highest probability trades; in this case, the market coming down into that blue level at $1,564 on February 28, when it came below the weekly average of $1,608.
At the mean, there is a 50/50 chance of the market going up or down, so usually stay neutral at that point. Wait for a higher probability trade, either the market coming down to the extreme below or going up to the extreme above the mean. Using the VC PMI, you get entry points and exit points.
As the market moves up into the area of distribution, if you are carrying multiple contracts, you can begin to lighten up around the Sell 1 and Sell 2 levels.
Looking ahead, if the market closes above $1,654, it would activate the Sell 2 daily level of $1,665 and the weekly Sell 2 level for the rest of the week at $1,736. If we close below $1,651, which is the weekly signal, it would negate this bullishness. If we close below $1,654, the daily Sell 1 level, it would negate this bullishness, and would also activate a bearish trigger. The target then becomes $1,651. If we close again below $1,651, then we are looking at the weekly activating a short signal, and it activates the level below on the weekly of the mean back down to $1,608.
By closing above the Sell 2 level, the daily program begins to adjust the volatility factor. The analysis expands and connects the daily to the weekly, and then to the monthly, which connects all three trends. It also teaches you that trading at the mean is risky, since it is very choppy and the odds are 50/50 that the market will go up or down. If you trade at the extremes, you can get 90% to 95% probability trades.


Comments
Log in or sign up to join the conversation.