

What I would like to do on this report is look at the price of gold over the long term, intermediate- and short-term environment, and some possible harmonic alignments.
Here we are looking at the price of gold on the 30-year chart and you can see that going back to 1992, gold was trading roughly between $200 and $400 until about 2001 or so, which was essentially the bottom of the market. Gold traded between $300 and $400 between 2000 and 2002 until the market exploded into the highs that we saw by September 2011 of more than $1900.
(Click on image to enlarge)
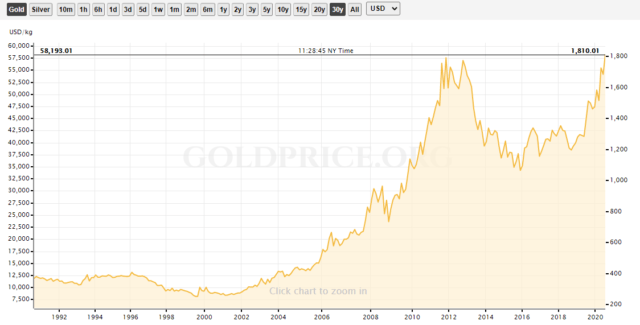
So 2002 was the beginning of the SARS pandemic and, although it was not as critical as the COVID-19 pandemic, it was a major turning point for gold, leading to an incredible upswing in the price of gold. Now it looks like we are either at the top resistance level in gold or we are about to break out into much higher ground. We're going to take a look at the Variable Changing Price Momentum Indicator (VC PMI) analysis of the extreme levels of supply and demand so we can get a good idea where gold's momentum might be heading based on where it has been.
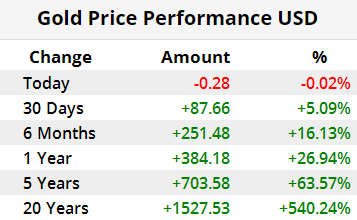
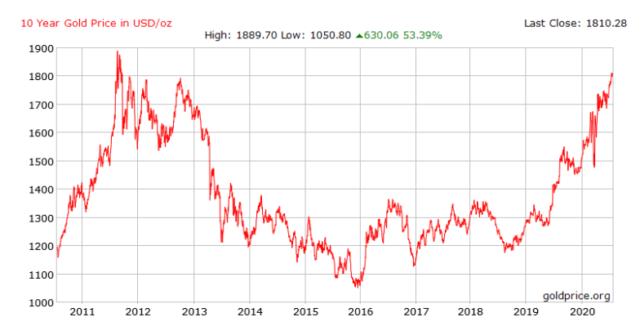
Going back 20 years, gold has appreciated from about $540 to the current $1800 levels, which is a 540% increase. In five years, it increased 63.57% or $703.58. In one year, it increased $384 or 26.94%. In the past six months, it increased $251.48, or 16.5%. In the past 30 days, it increased $87.66, or 5.9%, based on Friday's close, which was down slightly. The 10-year gold price high was at about $1889.70 and the low in the past decade was at about $1050.80. It's up as of the last close of $1810, up $760 about 72% for the decade.
Using the VC PMI and looking at the long-term nine-year gold cycle, we can identify the extreme levels above and below the means for the next nine-year cycle. In 2011, the average price of gold was $1572. In 2012, the average price was $1670. In 2013, the average price was $1411. In 2014, the average price was $1266. In 2015, the average price was $1160. In 2016, the average price was $1251. In 2017, the average price was $1257. In 2018, the average price was $1268. In 2019, the average price was $1393 and in 2020, the average price was $1660. The nine-year average price is $1545.
(Click on image to enlarge)
The nine-year VC PMI cyclical outlook is obtained by extrapolating the VC PMI for this period. The nine-year trend momentum of $1545 is bullish. The mean price for the year of $1497 is bullish. A close below $1497 would negate this bullishness. You should go neutral and, if you're long, take profits between $1833 - 2007.
Nine-Year VC PMI Cyclical Outlook
Summary
The nine-year trend momentum of $1545 is bullish.
The nine-year VC PMI of $1497 is bullish.
A close below $1497 stop, negates this bullishness neutral.
If long, take profits at $1833 - $2007.
(Click on image to enlarge)
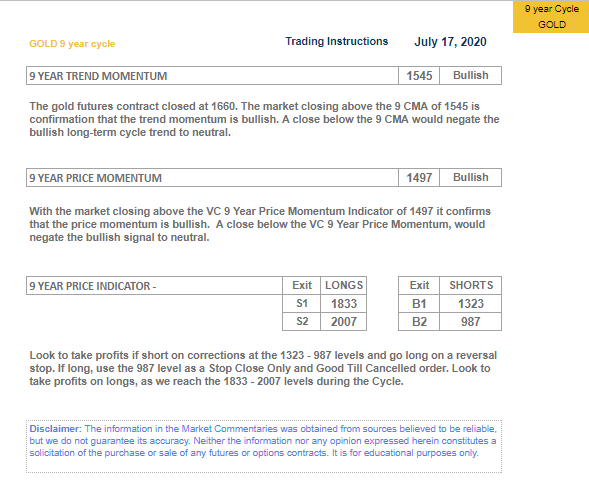
The nine-year gold cycle was calculated as of the close of July 17, 2020. The average price is $1660 for 2020 so far. The market closing above the cyclical moving average based on the nine-year cycle moving average of $1545 is confirmation that the trend momentum is bullish. Therefore, we have been able to identify that the next nine-year trend momentum cycle is bullish. The artificial intelligence behind the VC PMI also tells you that you can use this level as a protective level. It also tells you that a close below the nine-year moving average would negate the bullish long-term cyclical trend to neutral. So we have identified that the $1425 - $1545 level is the trend momentum, and the average of the nine-year cycle for gold is $1545.
With the market closing above the VC PMI nine-year price momentum indicator of $1497, it confirms that the price momentum is bullish. However, the AI also gives you an alternate count in order to protect your position. If gold closes below the VC PMI nine-year price momentum indicator of $1497, it would negate the bullish signal to neutral. The nine-year moving average is $1545, so the market closing above that moving average is bullish. We also identified that the VC PMI level of $1497 is bullish because the market closed above $1497 and when the price closes above the VC PMI it automatically activates the levels above as the targets. In this case, the nine-year VC PMI indicator is suggesting that the Sell 1 level is $1833 and the Sell 2 level is $2007. The VC PMI clearly tells you to take profits on longs as we reach the $1833 and $2007 levels during the cycle period, which could occur any time from now through the next nine years. These are the targets that the nine-year cycle has identified moving forward from here.
Annual Targets
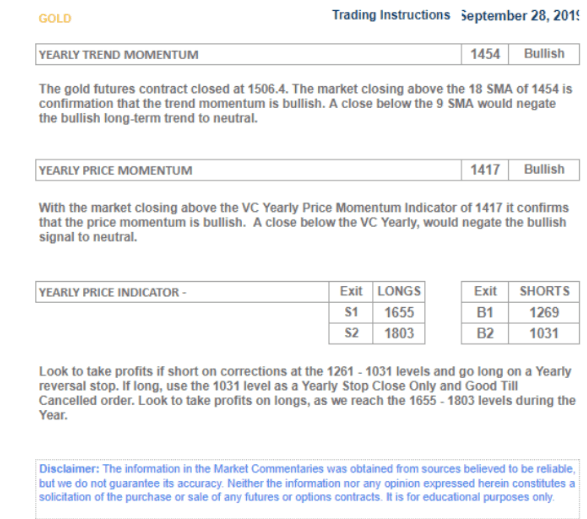
On Sept. 28, 2019, on Seeking Alpha, Ticker Tocker and other news platforms, we published a report identifying the annual targets for gold based on the supply and demand for the 2019 to 2020 season. We use the September to September calendar period to analyze the seasonals of the 360-day period of the cycle. The market was at $1506.40 on Sept. 27, 2019, and it activated a bullish trend momentum for the rest of the period into 2020. The fact that the market closed above $1417, activated the targets of $1655 and $1803 through Sept. 27, 2020. This report told you very clearly that the Sell 1 level of the annual targets was $1655 and the Sell 2 level was $1803. These were the expected targets for the annual report that we published in 2019.
Gold: Annual Targets And S&D Prices For 2019/2020 Season
Summary
With the market closing at $1,506.40 on Sept. 27, 2018, it activated a bullish trend momentum for the rest of the period into 2020.
The fact that the market closed above $1,417, activated the targets of $1,655 to $1,803.
Conversely, the first level down is a close below $1,454, which would negate this bullish trend momentum to neutral.
A close below $1,417 would negate this long-term bullish trend to neutral and a close below $1,417 activates the targets below the mean of $1,269 (Buy 1) to $1,031 (Buy 2).
(Click on image to enlarge)
Monthly Targets
The monthly VC PMI report for July that we published reported that the market traded pretty much around the $1800 level that was expected. Gold met the annual targets and the annual signal now is neutral or completed. On July 1, the monthly trend momentum of $1649 is bullish because the price closed above it by closing at $1800. The monthly VC PMI of $1754 also is bullish. Even though these two indicators are bullish, in order to identify a higher probability indicator we are also watching for a close below $1754 as a protective level that would negate the bullishness, changing the market to neutral. The $1754 level is the level we believe you can hold on to for the rest of the month of July. Unless it closes below $1754, the signal will remain bullish and the VC PMI tells you, that if you are long, to take profits at $1837 to $1887.
July 1, 2020: Gold Monthly Report
Summary
The monthly trend momentum of $1649 is bullish.
The monthly VC PMI of $1754 is bullish.
A close below $1754 stop, negates this bullishness neutral.
If long take profits $1837 - $1887.
(Click on image to enlarge)
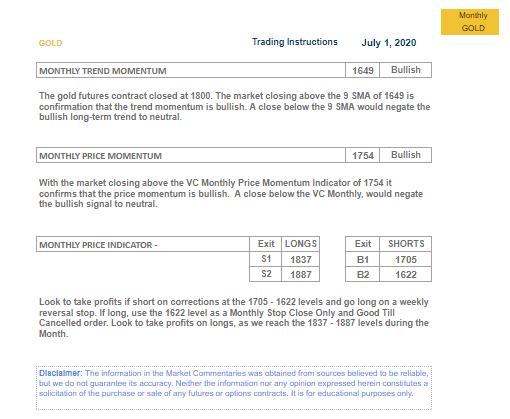
On July 1, 2020, the gold futures contract closed at $1800. The market closing about the ninth-month simple moving average of $1649 confirms that the trend momentum is bullish. A close below the ninth-month simple moving average would negate the bullish long-term trend to neutral. The monthly price momentum of $1754 is also bullish since the market closed above $1754. It confirms that the price momentum is bullish but if it closes below $1754, it would negate the bullish signal to neutral. So $1754 is a pivotal point to use as a protective level as you begin to trade above the $1800 handle. By trading above the monthly price momentum or the VC PMI, it activates the targets of $1837 to $1887 and the VC PMI tells you clearly to take profits if you're long. It also prepares you, if you're short, that if the market comes down to $1705 to $1622, that these are areas at which to go long on a weekly reversal stop and if you reverse from there into that $1700 level, then you can use $1622 as your initial stop. The VC PMI tells you to look to take profits on your long positions as we reach $1837 to $1887 during this week.
Strategy
If we review the nine-year cycle, it identifies the Sell 1 target of $1833 and the Sell 2 level of $2007.
If gold gets to those levels, the supply and demand tug of war will identify the direction of the momentum of the market. $1833 is a major target on the nine-year cycle initially. It's an active target of the daily and the annual VC PMI analysis. Gold completed the target at $1803, so $1803 is now a level of support. If we close below $1803, it would activate a short trigger on the annual targets. The annual Sell 1 level of $1803 is an area of support. If gold breaks through that level and it closes below, it will activate a short annual trigger with a Sell 1 annual target of $1655.
The monthly Sell 1 level is $1837. If the price runs up this month to $1836, it would match harmonically the nine-year cycle of $1833, which is a key relationship that the VC PMI algorithm identifies as the most optimal mathematical relationship on which to trade on. When the annual, monthly, weekly and/or daily levels match, they offer the highest probability trades. The matched monthly and 9-year cycle levels offer high probability trades. The nine-year cycle Sell 1 level at $1833 has a 90% probability that if the price is activated, gold will revert back to the 9-year cycle mean. The monthly levels offer the same 90% probability at the Sell 1 level, although if both levels match, the probability is even greater. The Sell 2 level is a 95% probability factor.
Current Situation
Gold traded last at $1821.50. If we start looking at the weekly levels, the average price for the week is $1808. The Sell 1 level is $1824. The Sell 2 level is $1836. These two levels are the levels that are the extreme above the mean of $1808. The Buy 1 level of the extreme below the mean is $1796 and the Buy 2 level is $1779. We are moving into the Sell 1 target area, which was completed at the daily average price of $1807. The weekly average price is $1807, which is also coming into play in a form of harmonic convergence, further validating the VC PMI analysis.
(Click on image to enlarge)
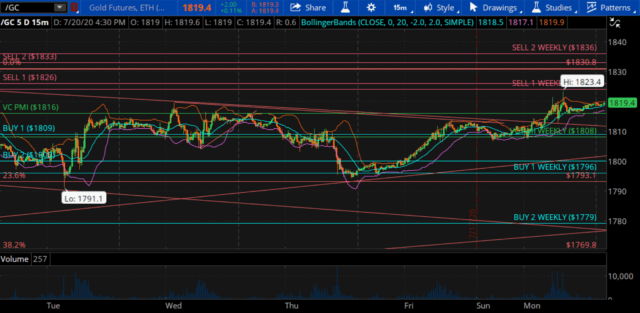
Even though the algorithm suggests that you don't trade futures when the price is around the average price, it does identify the extreme levels above the mean and it identifies the bullish price momentum daily with the targets of $1819 to $1826. For gold, $1823 was the highest so far. Gold is completing the targets of the daily and the weekly. The Sell 2 weekly is all the way up to $1836, so once again $1833, $1837, and $1836 are the pivot points that we've identified. We want to see the kind of buying up there against the selling. If you've been long since $1500 based on our recommendations in our September annual report, $1500 to $1823 is a pretty good profit. It is more than likely that the market is reaching extreme levels mathematically, which is indicating what most technical analysts call an overbought condition in the market. It could get more overbought, but it is less and less likely, the higher it goes.
Methodology
The VC PMI is not emotional. It's systematic. It's using probabilities to identify the best trades and depending upon your skills, your level of risk and money management, you can use the VC PMI as a GPS to guide your trading. If you trade with emotion, the market will always win. You want to identify how to work with the highest probabilities in your favor. Most traders have pretty much a standard deviation of about 50/50, winning half the time and losing half the time. What made the difference for us was the application of the VC PMI. It removes emotion from the equation. It also removes the fundamental aspects of the market. It's purely technical and it provides specific criteria to execute from a technical point of view.
Fundamentals
(Click on image to enlarge)
If we look at the fundamentals behind the market, gold has never been in a better position to begin what looks to be a major long-term bull market. The long-term charts indicate that the price in gold is about to break out to the upside. If you look at the price of gold going back to 1992 when it was at $300 or $400, and then the price of gold pretty much exploded. From then to the high of $1900 in 2011, gold came down from $1900 all the way down to $1050. Now if you could stand that correction, then you're doing great but when you're getting $10 or $20 moves there's an incredible opportunity to capture short-term counter-trends. The short-term counter trends develop without affecting the long-term outlook in the market. The $300 or $400 decline that you chose to hold on to can become additional equity for you to dollar average your long-term position. If you take that profit and you put it back into the long-term position the volatility of this market has been wonderful ever since the March 24 crash, when gold came down to $1454. Ever since we've rallied and we're trading at $1820, that's almost a $400 move.
(Click on image to enlarge)
You want to be cautious up here even though the sentiment of the market is extremely bullish. The COVID-19 situation is still not in control. There's no national leadership in terms of how we are going to deal with this and so that has created a bit of a risk of panic buying into the gold market. That has brought the prices up fundamentally to these levels. Now the prices we identified of $1833 and $1837 are extrapolated mathematically using the VC PMI algorithm. What happens in terms of the fundamentals of the market that drives the price up there may very well be this bullish sentiment, not only with regard to the economic damage that was done, including the large number of small business bankruptcies, people are suffering serious economic chaos. We are still trying to see whether the stimulus that has been provided to the market is going to be enough. There's some talk about a new package that potentially is going to be coming out into the market, but it's uncertain. The system is going to need a lot more than what they already have printed in terms of cash, so you know we're looking at a continuation of stimulus coming into the market, not only here in the United States but on a global basis. Humanity is at risk. People are dying while our so-called leaders are playing political games.
Nevertheless, the market is telling us that gold even on a long-term basis is in a major area of distribution. We have identified that the $1833 area and $1837 are targets based on the long-term and short-term analysis of the market. If we close below $1803, we are going to activate an annual short trigger point with an initial target of $1554. A close under $1819 is going to activate another short trigger.
A daily close under $1819 is going to activate a daily short trigger. This is a new signal. We recommend that day traders have a specific target in mind when you come into day trade. We have a target of $300 per contract and the sooner that I get it the sooner I take it. It doesn't affect my intermediate to longer-term outlook in the market. The VC PMI is saying that you want to be looking at selling rallies even if it's on a day-trade basis. On the weekly, monthly or nine-year cyclical basis, you want to be selling rallies into this $1833 to $1837 area. If we run up to $1836, it would connect the harmonics of the weekly with the monthly and with the nine-year cycle. That would be a triple harmonic. Once again, sell the rallies. Look for trigger points on a close below $1819 and on a close below $1803, which would activate the annual target. A close below $1819, would activate the initial target of $1808. A close below 1803 activates the annual target of the Sell 1 level of 1655.


Comments
Log in or sign up to join the conversation.