

The XAU/USD (Gold) weekly chart made a bearish reversal contrary to our previous analysis. This indicates that price action has either completed a wave 1 or A (pink).
This article analyses what to expect from the wave 4 retracement (purple).
Price Charts and Technical Analysis
(Click on image to enlarge)
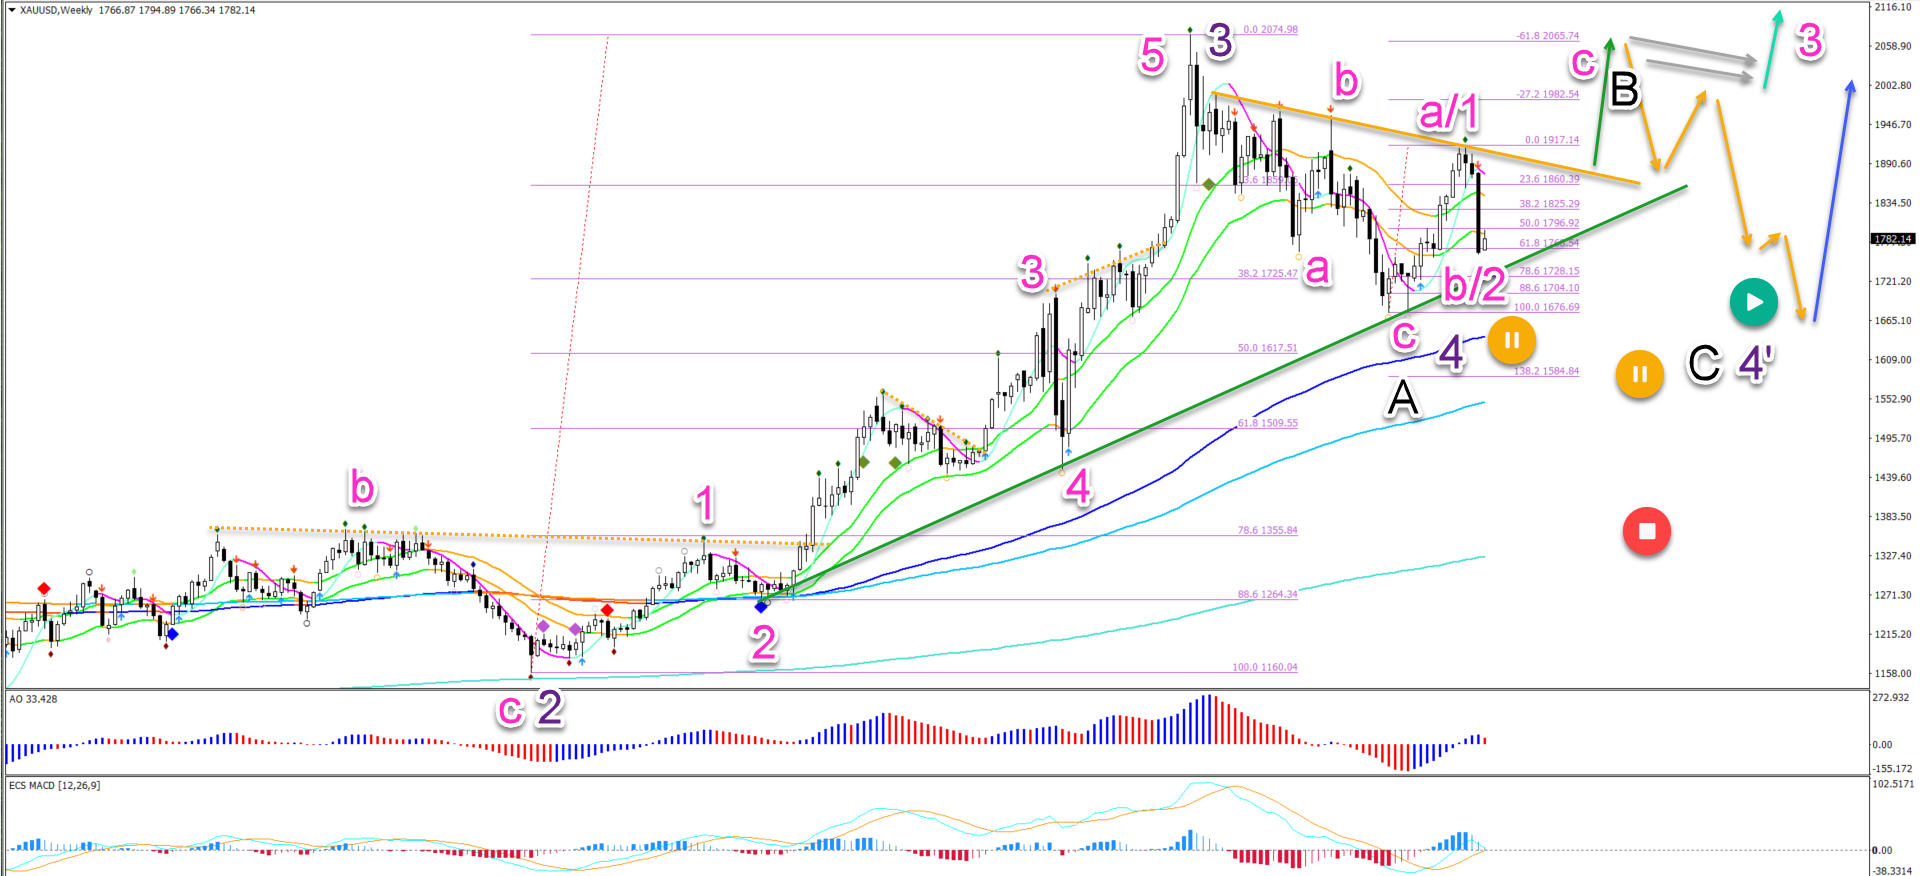
The XAU/USD chart was unable to break above the resistance trend line (orange) and is now testing the support trend line (green):
- A bullish bounce at the support line (green) and 61.8%, 78.6% or 88.6% Fibonacci retracement levels of the wave B/2 (pink) could confirm one more bullish swing.
- The target is the previous top. A break below the 100% Fib places the bullish ABC or 123 (pink) on hold (orange sign).
- If price action gets close to the previous top, then the price reaction will be very important.
- A bull flag (grey arrows) pattern could indicate more uptrend (aqua blue arrow).
- A bearish reversal (orange arrows) could indicate a bearish ABC (black) pattern in wave 4’ (purple).
- Any deeper retracement places the uptrend on hold (orange and red signs).
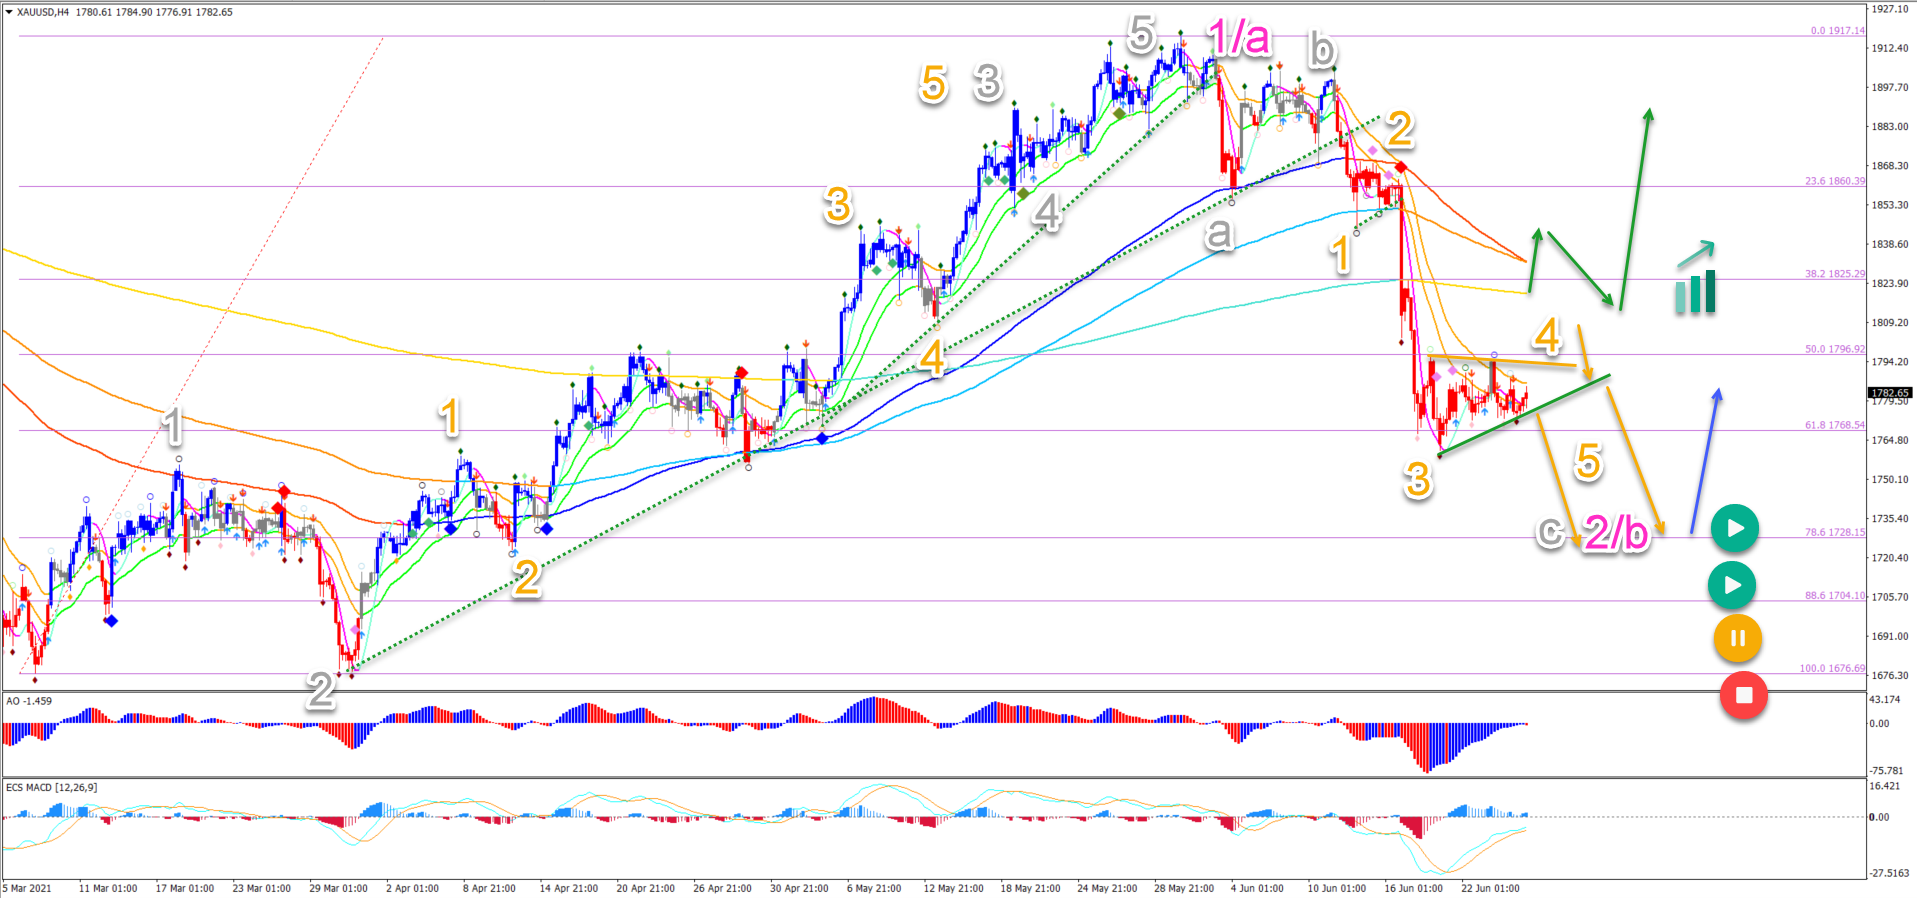
On the 4 hour chart, price action seems to be building 3 corrective waves down after 5 impulsive waves up:
- The 5 bullish waves (grey) completed a wave 1 or A (pink).
- Now an ABC (grey) zigzag pattern seems to be taking place in wave 2 or B (pink).
- A bearish breakout (orange arrows) below the support line (green) could aim at the 78.6% Fibonacci level.
- A bullish bounce (blue arrow) at the deep Fibonacci retracement levels is expected.
- A bullish breakout above the long-term moving averages could indicate the end of the bearish ABC (grey) as well and the start of a bullish price swing.
(Click on image to enlarge)



Comments
Log in or sign up to join the conversation.