

In 2011, Gold bugs were gushing with bullish sentiment as Gold prices rallied sharply before peaking around $1900.
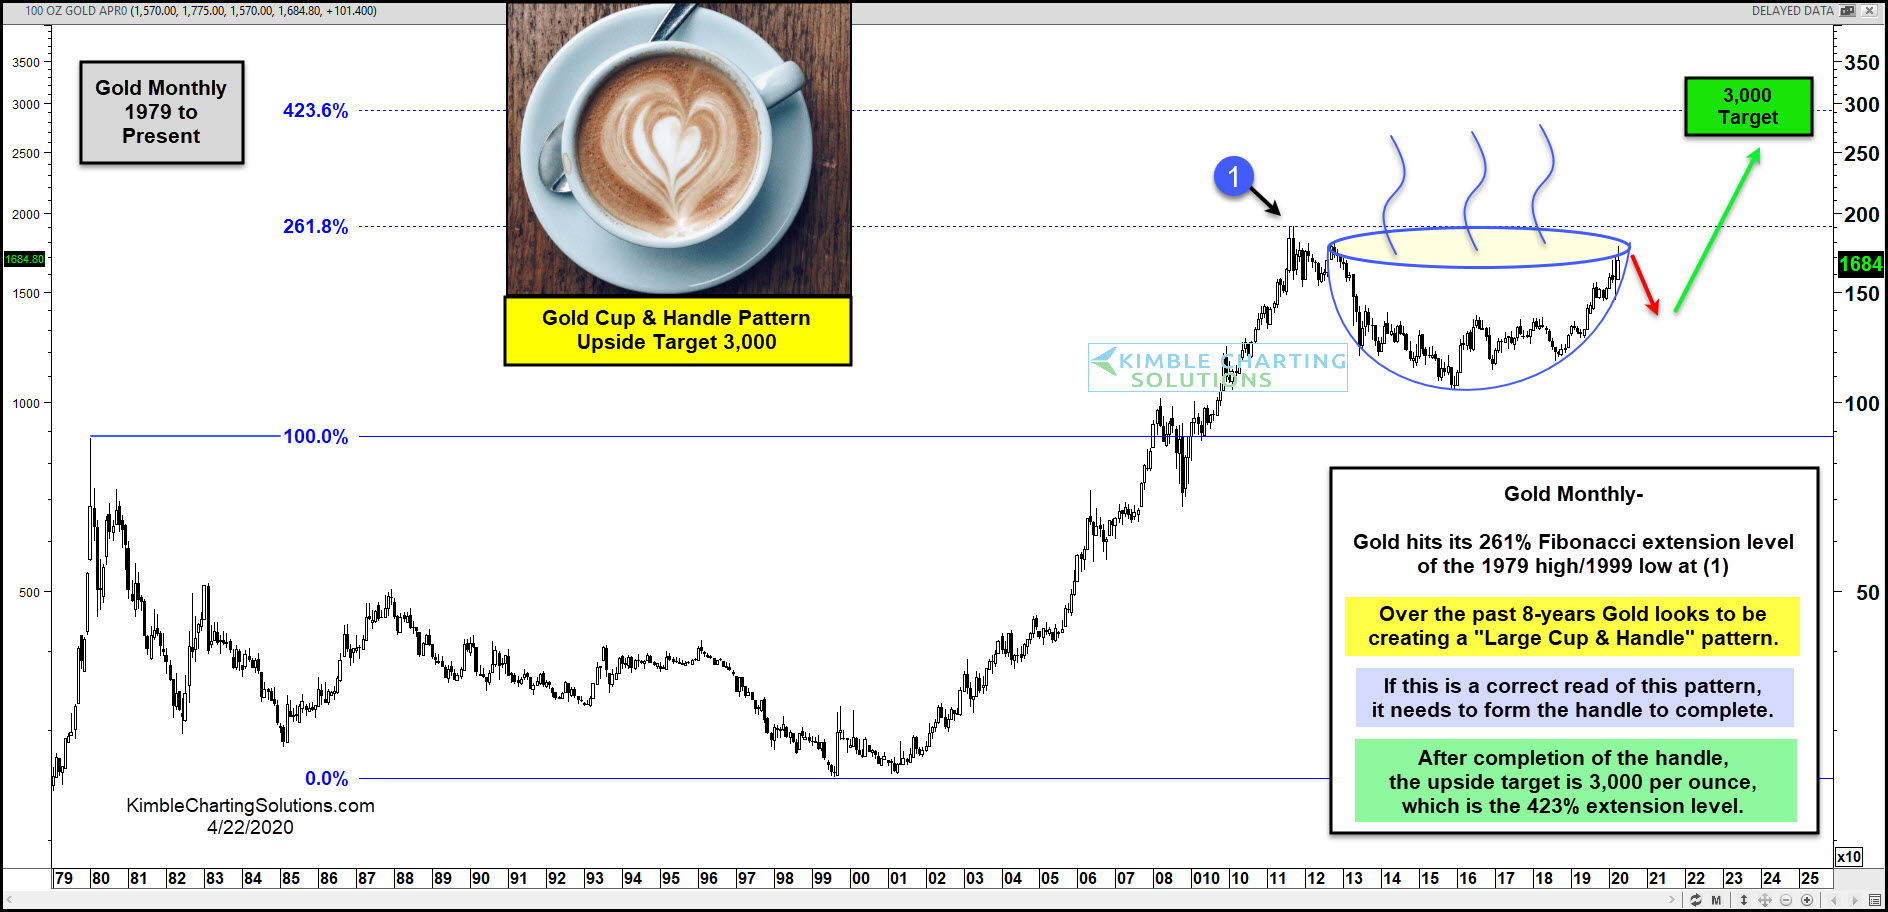
That peak formed at the 261.8 percent Fibonacci extension of the 1979 high / 1999 low at (1) on today’s chart.
The next 8 years saw Gold prices enter a bear market before bottoming and turning higher in what could be a cup and handle pattern setup.
This pattern has the attention of gold bulls. Now, all we need to see is a handle form for this to pattern to be complete. That would entail a pullback and rally higher.
Should this pattern form and lead to new highs, it could then target $3000 (the 423.6 percent Fibonacci extension).
(Click on image to enlarge)



Comments
Log in or sign up to join the conversation.