


Gold price retreats by over 2.30% on Friday amid fears that prolonged hostilities between the US and Iran could trigger a second wave of inflation, forcing central banks to hike interest rates. The XAU/USD trades at $4,551 after bottoming at around $4,511.
XAU/USD slides as yields surge and Fed cuts vanish
US Treasury yields are soaring, with the 10-year T-note coupon hitting yearly highs at 4.591%, up 10 basis points and poised to challenge the 2025 high of 4.627%. The Greenback has followed suit, as shown by the US Dollar Index (DXY), which tracks the performance of the American currency against the other six, up 0.33% to 99.19.
Overnight news of US President Donald Trump revealing that he’s losing patience with Iran pushed Oil prices higher, amid speculation of a resumption of hostilities. US inflation data released on Tuesday and Wednesday had erased the chances of the Federal Reserve (Fed) easing, a headwind for Bullion, which fares well in low interest rate environments.
The Fed, under Kevin Warsh’s first meeting as the new Chair, is expected to hold rates unchanged in June and through the end of the year, according to Prime Terminal data.
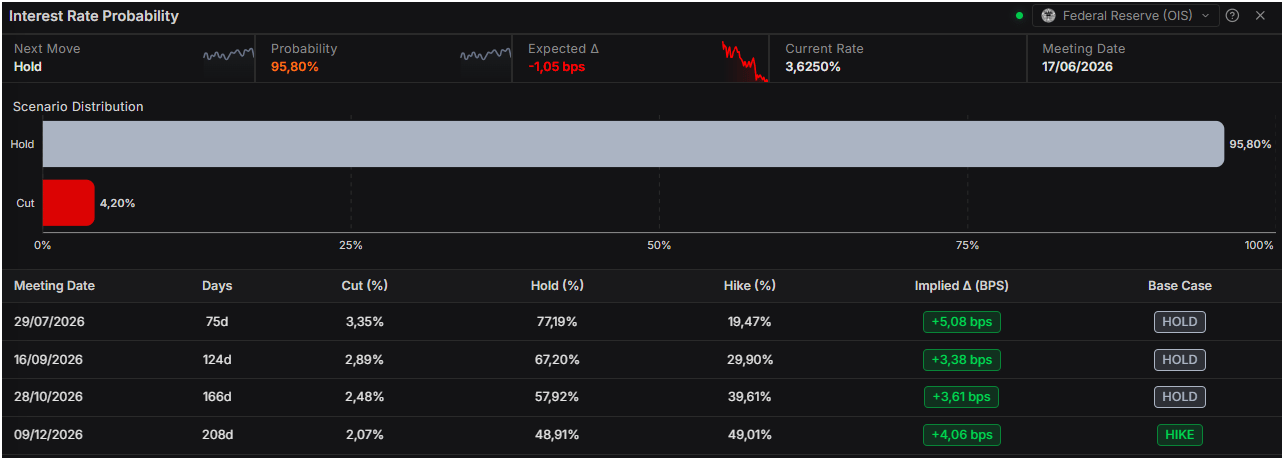
Source: Prime Terminal
Several Fed policymakers stressed this week that containing inflation remains a priority, with some leaving open the possibility of further rate hikes if price pressures persist.
US data showed Industrial Production rose 0.7% MoM in April, beating forecasts of 0.3% and rebounding from March’s 0.3% decline.
Next week, US traders are now awaiting housing and labor market data, as well as remarks from Fed officials.
XAU/USD technical outlook: Gold set to trade sideways, but bears loom
From a technical standpoint, Gold is poised to consolidate around $ 4,500–$4,650 in the short term after clearing key Simple Moving Averages (SMAs) during the week. Momentum is clearly bearish as depicted by the Relative Strength Index (RSI), falling toward oversold territory after diving beneath the 50-neutral level two days ago.
If XAU/USD clears the next area of interest being the May 4 daily low of $4,500, this opens the door for further losses. Downwards, the next support would be the March 26 daily low of $4,351, before challenging the 200-day SMA at $4,322.
On the upside, if Gold regains control above $4,600, the next resistance is the 20-day SMA at $4,662, ahead of the psychological $4,700. The next area of interest is the 50 and 100-day SMAs at $4,729 and $4,785, respectively. Up next is the $4,800 milestone.
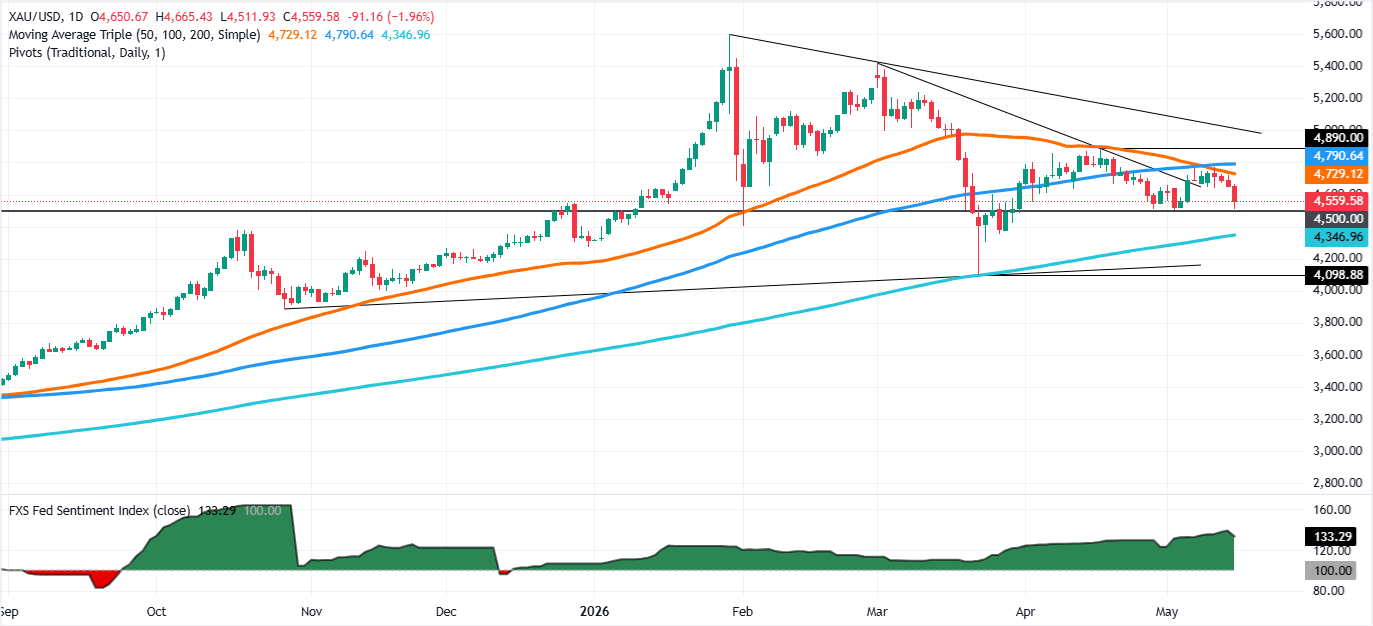
Gold daily chart



Comments
Log in or sign up to join the conversation.