


Gold price (XAU/USD) rises to near $4,255 during the early Asian session on Thursday. The precious metal extends the rally, marking its biggest daily jump since February, as optimism over a potential deal to reopen the Strait of Hormuz eases energy-driven inflation fears and reduces the odds of the Federal Reserve (Fed) raising interest rates.
Iran’s Foreign Ministry spokesperson Esmaeil Baghaei said on Wednesday that a deal with Oman on a route through the Strait of Hormuz is being “finalised”, but the US and Israel still pose a danger to ships in the vital waterway.
Meanwhile, US President Donald Trump claimed a deal could be reached on Wednesday, with continued diplomatic efforts potentially paving the way for US-Iran talks to resume. US Secretary of State Marco Rubio and Treasury Secretary Scott Bessent both said progress had been made in those talks.
Reports of a potential interim agreement to clear and reopen the critical water could ease inflation fears and reduce expectations for aggressive Fed interest rate hikes. This, in turn, could boost the yellow metal in the near term.
Traders will closely monitor the release of the US July employment report, which is due later on Friday. This report could offer some hints about the health of the labour market and US interest rate path. Economists expect Nonfarm Payrolls (NFP) to rise by 80,000 in July, while the Unemployment Rate is projected to remain steady at 4.2% during the same period. In case of stronger-than-expected outcomes, this could lift the Greenback and weigh on the USD-denominated commodity price.
Gold underpinned as easing oil prices pull US yields lower
Analysts at Commerzbank highlight that the latest leg of support for Gold came as “US Treasury yields fell across the curve as lower oil prices eased inflation concerns,” helping to reinforce the metal’s recovery alongside the broader risk-on tone.
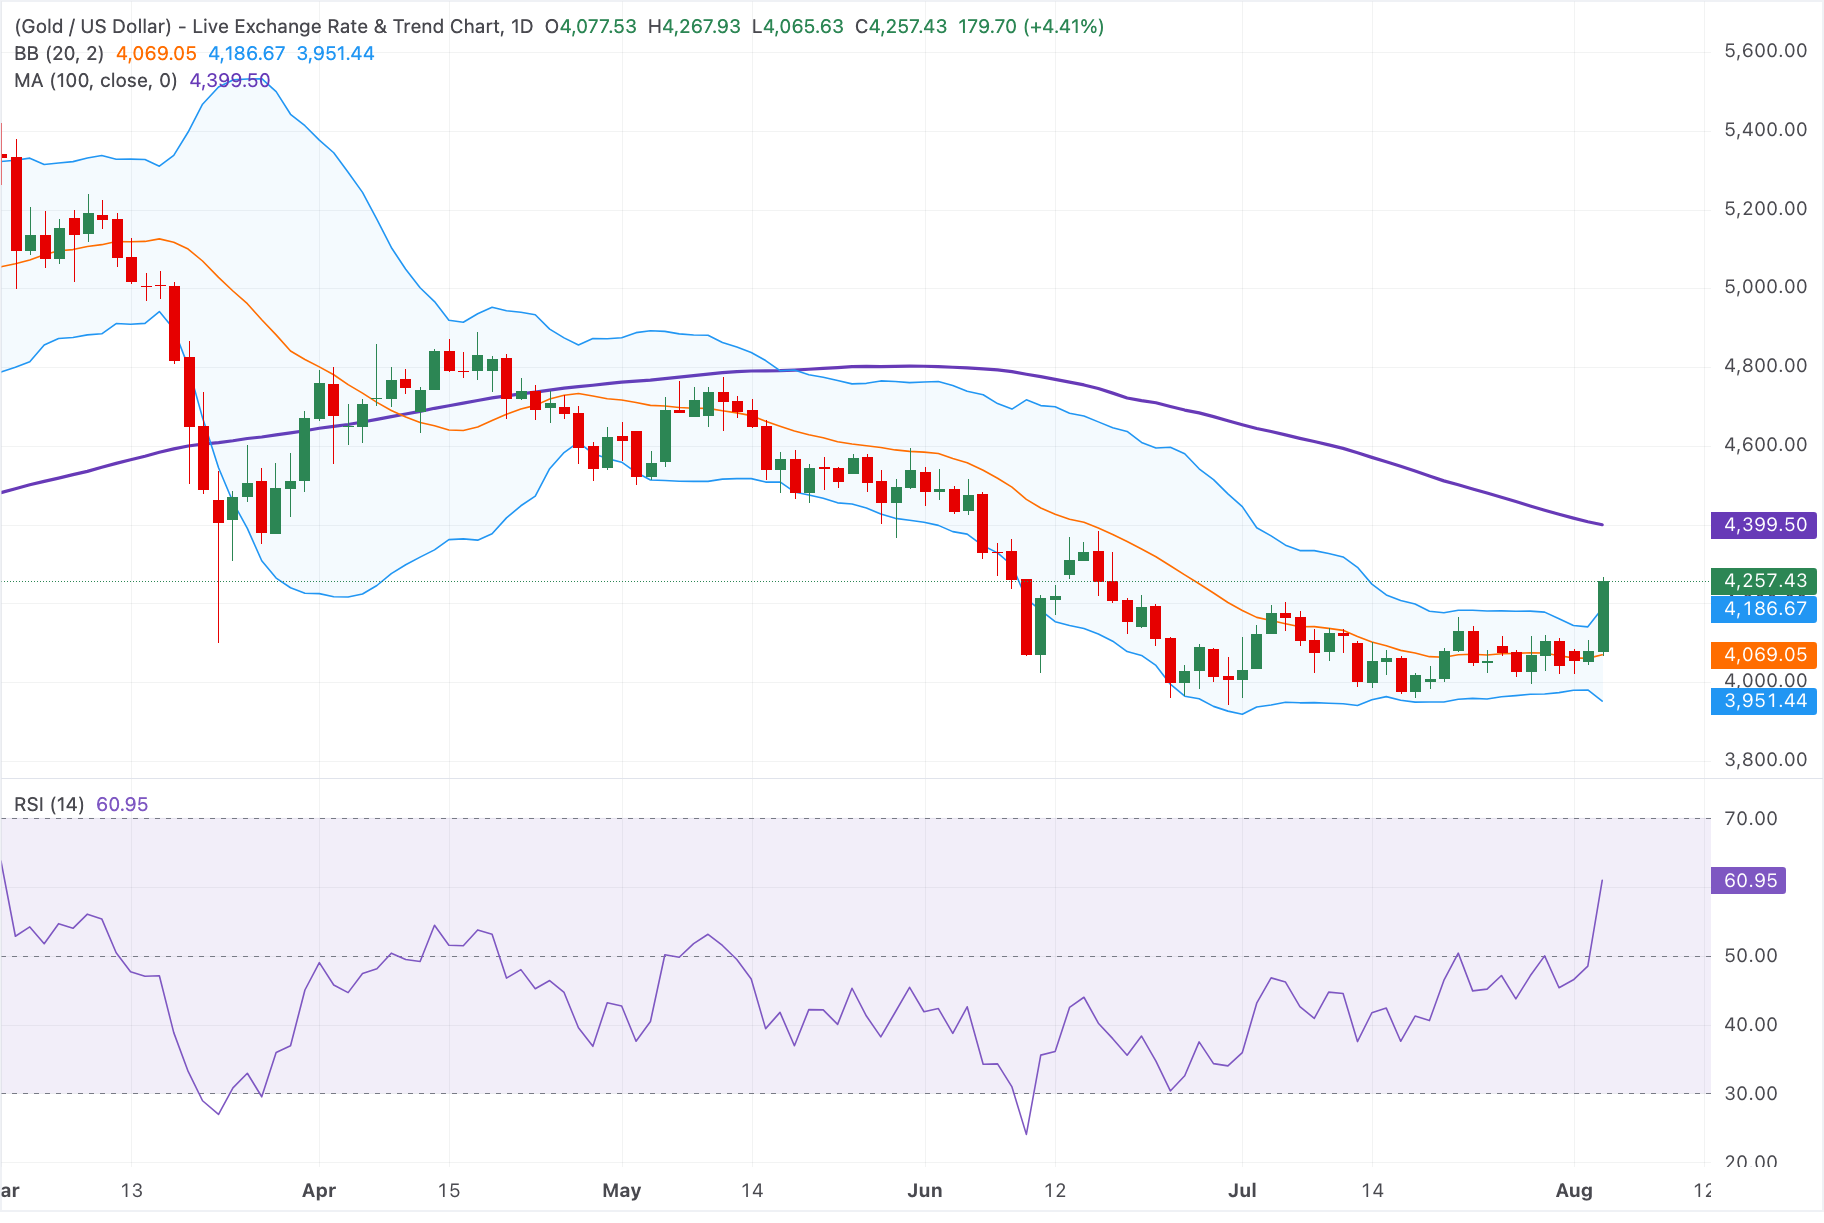
Technical Analysis: Gold remains capped below the key 100-day SMA in daily chart
In the daily chart, XAU/USD has pushed back above the 20-day simple moving average (SMA) component of the Bollinger Bands, shifting the near-term tone to neutral with a slight bullish tilt, yet broader gains remain capped while price holds beneath the 100-day SMA resistance. The Bollinger upper band now aligns as immediate support after being reclaimed, while the Relative Strength Index (14) at 60.95 shows firm but not overextended upside momentum, hinting that buyers still have some room before facing overbought conditions.
On the topside, a sustained break above the 100-day SMA around $4,400 would be needed to expose higher bullish targets and signal a clearer continuation of the up-leg. On the downside, initial support is now seen around the recently reclaimed Bollinger upper band near $4,185, followed by the Bollinger middle band / 20-day SMA region around $4,070; a loss of this area would likely invite a deeper retreat toward the lower Bollinger band support near $3,950.

Comments
Log in or sign up to join the conversation.