

Gold (XAU/USD) has made a bullish bounce at the 38.2% Fibonacci retracement level. The shallow Fib is typical for a wave 4 pattern (purple) within a strong trend.
This article reviews the expected price swings and wave patterns.
Price Charts and Technical Analysis
(Click on image to enlarge)
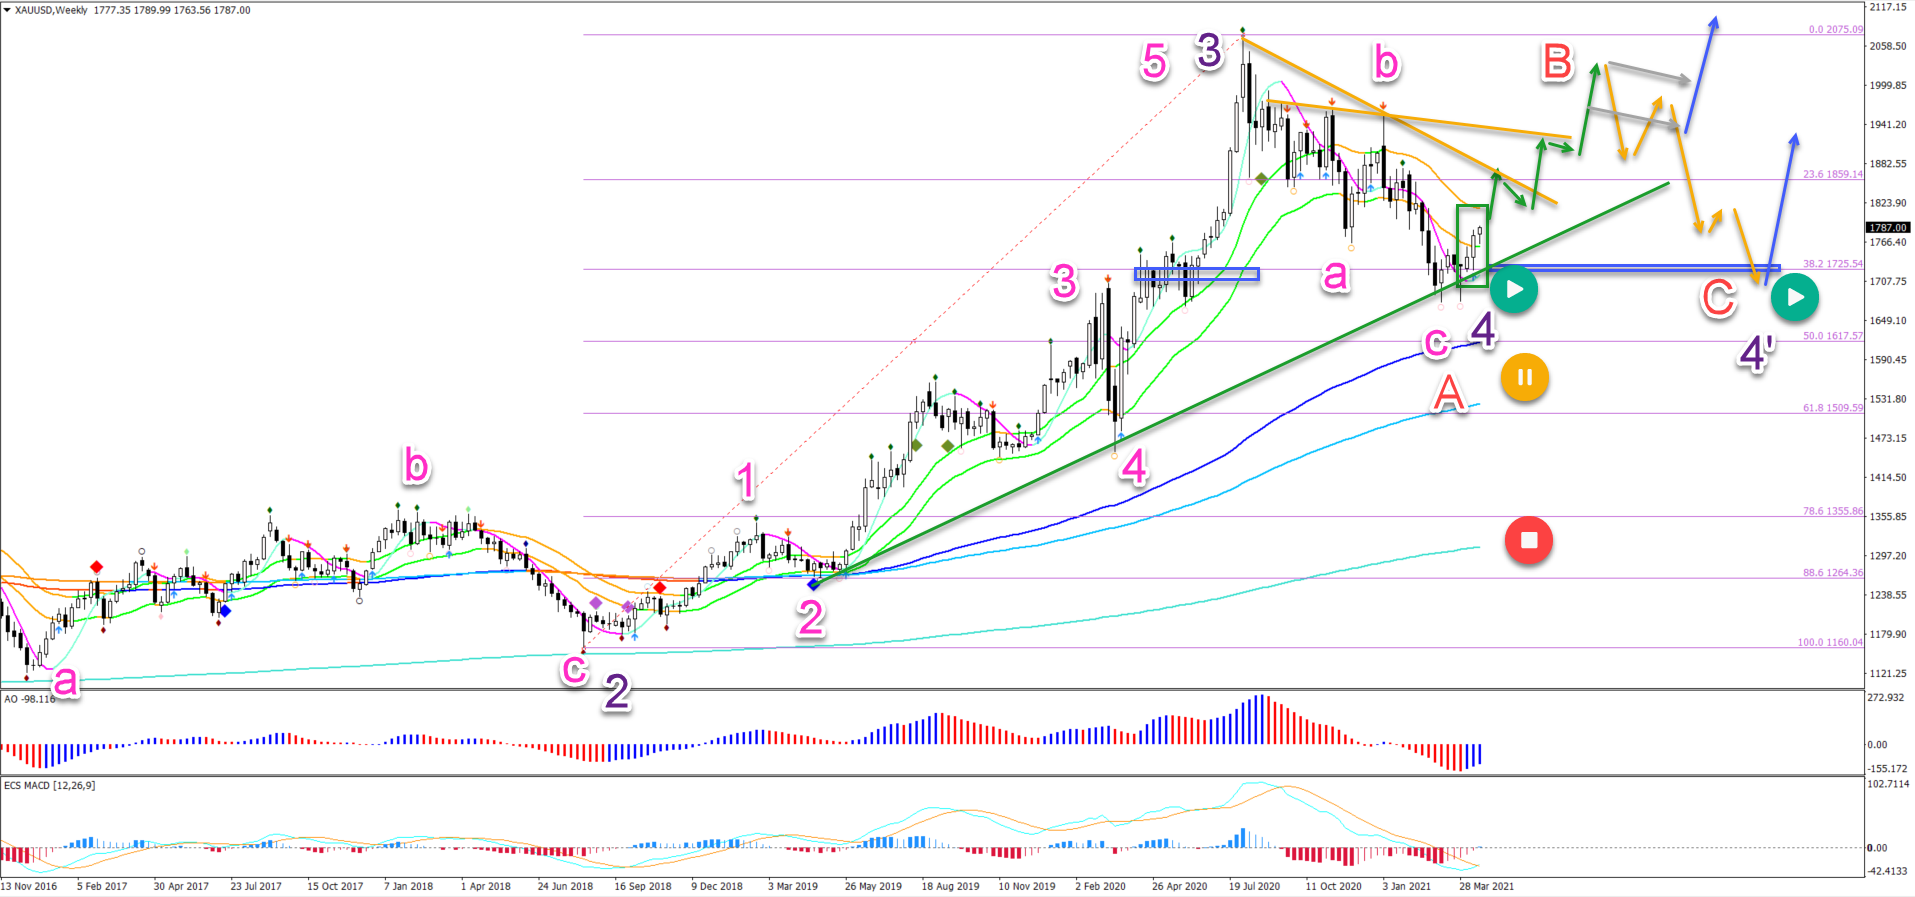
The XAU/USD weekly chart made a very strong bullish impulse. This is probably a wave 3 (purple). The correction seems to be part of an ABC (pink) in wave 4 (purple):
- No divergence pattern is visible, which means that the uptrend is not losing momentum.
- The uptrend is fully established, with the 21 ema zone above the 144 ema, 233 ema and 610 ema.
- Therefore, it seems probable that the uptrend will eventually continue for at least one more higher high.
- The first question is whether price action will be able to bounce significantly away from the 38.2% Fib. We already see bullish price action (green box). A strong bullish weekly candle in the next 3 weeks would confirm an upside (green arrows).
- The next question is whether the wave 4 (purple) is already completed or will price action extend the ABC pattern with a larger ABC (red). In that case, there could be an ABC up, but then an ABC down or 5 wave pattern down to complete wave C (red) of wave 4’ (purple).
- The uptrend remains valid as long as price action remains above the 50% Fib. A break below it places the uptrend on hold (yellow) whereas a strong retracement invalidates it (red).
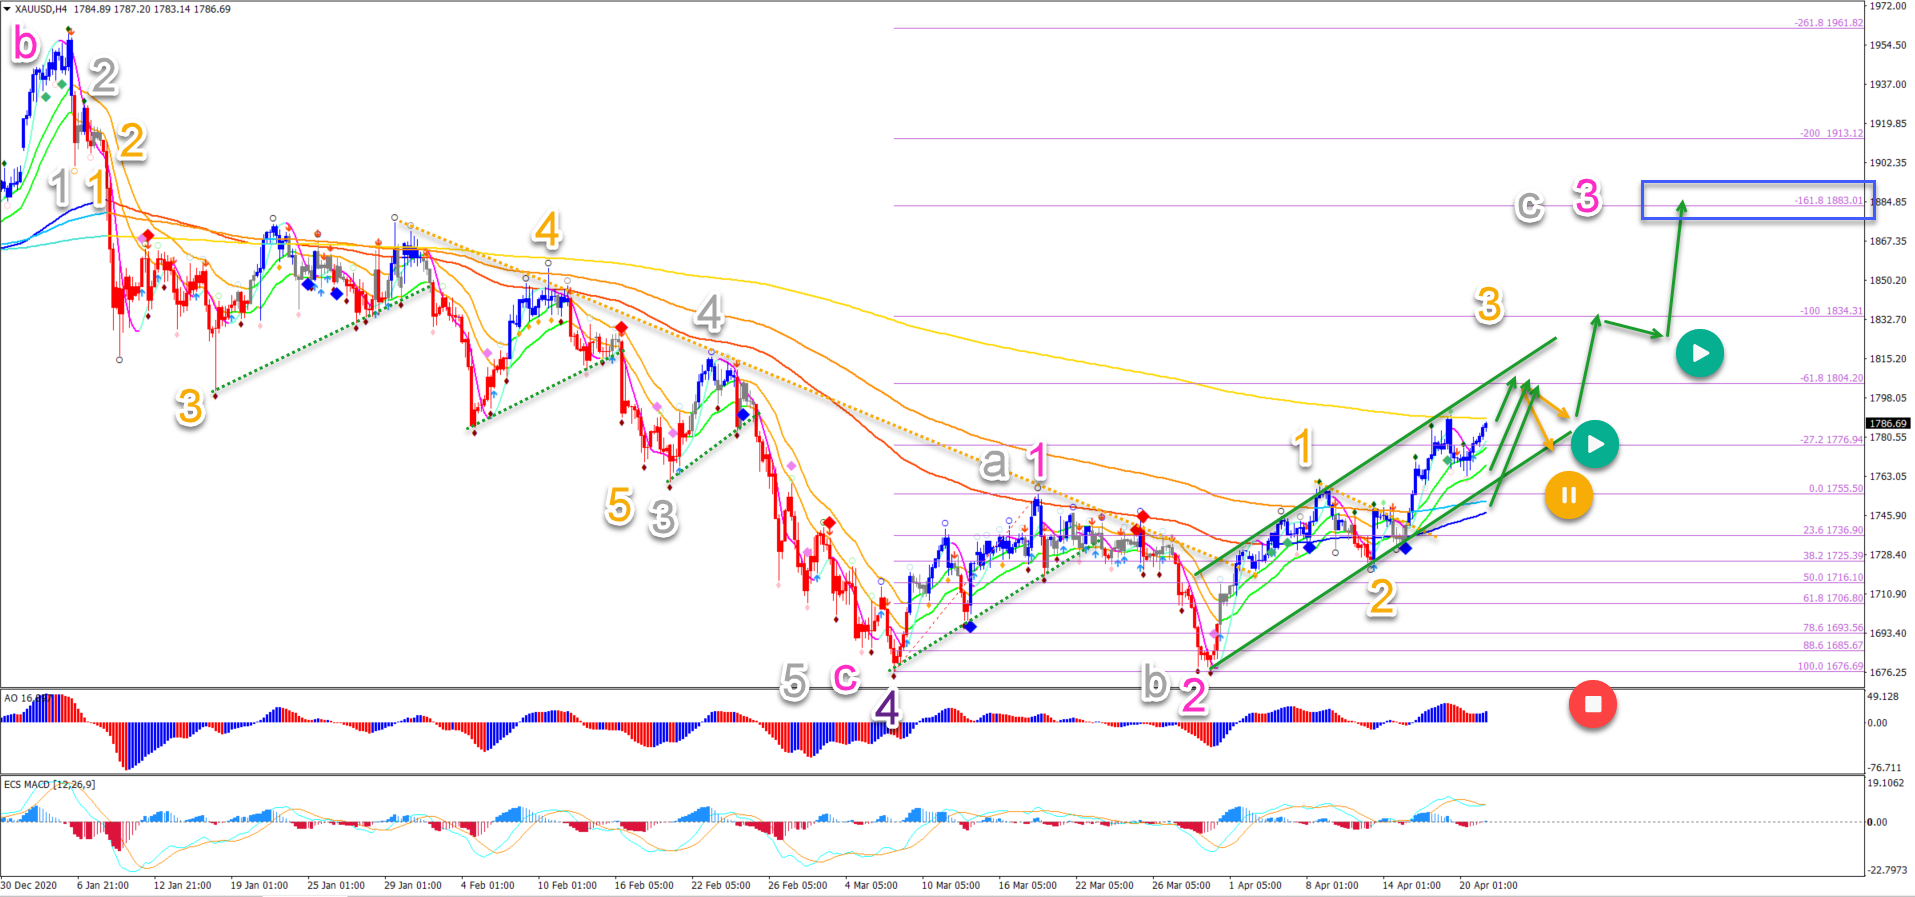
On the lower 4 hour chart, we can see signs that the bearish price swing is completed. A wave 5 pattern in wave 5 seems to finish the bearish push:
- The wave 2 (pink) did not break the bottom of wave 1 (pink).
- The current bullish swing could there be a wave 3 (pink).
- The alternative is an ABC (grey) pattern rather than a 123.
- The bullish channel (green) is key for the wave 3 (pink). Price action should stay in the channel.
- An immediate push (green arrows) up towards the -61.8% Fibonacci target is likely. But price action needs to break above the 610 ema.
- A pullback could find support at the 144-233 ema zone.
- A bearish bounce (orange arrows) at that target should take price action back to the channel bottom and 21 ema zone. This zone should act as support and bounce (green arrows).
- The main wave 3 target is the -161.8% Fibonacci target (blue box).
(Click on image to enlarge)



Comments
Log in or sign up to join the conversation.