


Gold price (XAU/USD) falls to near $4,610 during the early Asian session on Thursday. The precious metal retreats from a three-month high as US inflation data came largely in line with expectations, increasing expectations of a Federal Reserve (Fed) interest-rate hike next month.
Data released by the US Bureau of Economic Analysis (BEA) on Wednesday showed that the Personal Consumption Expenditures (PCE) Price Index inflation remained unchanged at 3.7% YoY in July. This figure came in hotter than the market expectation of 3.6%.
Meanwhile, the core PCE Price Index, which excludes volatile food and energy prices, held steady at 3.3%, in line with the market consensus. On a monthly basis, the PCE Price Index and the core PCE Price Index both rose by 0.2% in July.
“Gold’s price action up to today’s data was just some profit taking ... PCE data came in largely in line with expectations, so we’re consolidating within yesterday’s range at this point,” said Peter Grant, vice president and senior metals strategist at Zaner Metals.
Markets are now pricing in nearly a 38% chance of a 25 basis points (bps) Federal Reserve (Fed) rate hike in September, compared with 36% before the data, according to the CME FedWatch tool.
Traders brace for the upcoming speech by US Federal Reserve (Fed) Chair Kevin Warsh at the Jackson Hole Symposium on Friday for more clues on the outlook for interest rates. Any hawkish remarks from Fed officials could weigh on the yellow metal in the near term.
US long bond squeeze fails to trigger capitulation in gold
Analysts at Rabobank highlight that, “as Bloomberg puts it today, ‘Short Squeeze in US Long Bonds Shows ‘Bessent Put’ at Work.’” They add that, despite the pronounced rally in US long-dated Treasuries, “Gold is not showing signs of capitulation, however,” underscoring the resilience of the precious metal even as bond markets respond to shifting sentiment.
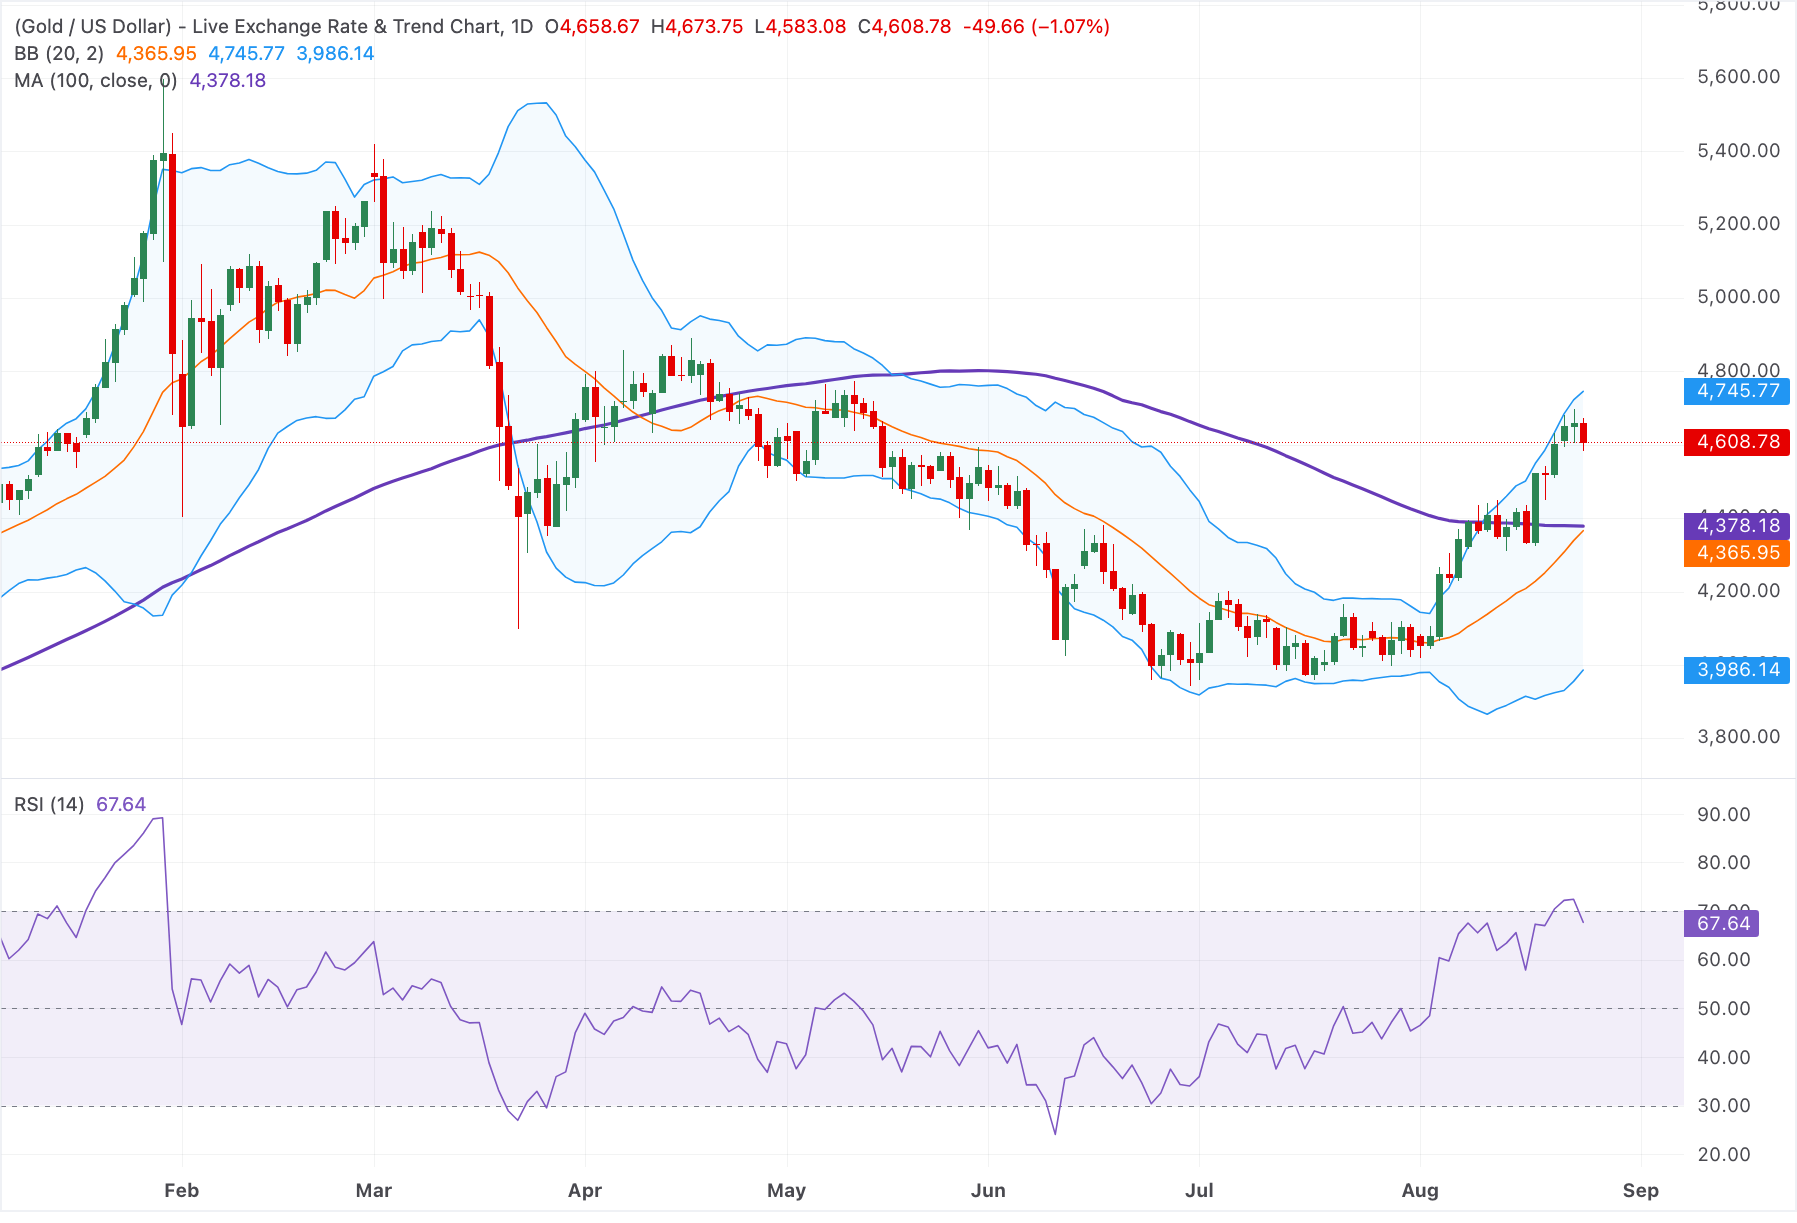
Technical Analysis: Gold
In the daily chart, XAU/USD holds a bullish near-term bias as price remains above the 100-day simple moving average (SMA) and the 20-day Bollinger middle band, keeping the broader uptrend supported. The latest Bollinger configuration shows price pressing the upper half of the envelope, while the Relative Strength Index (14) at 67.64 hovers just shy of overbought territory, suggesting strong but increasingly stretched upside momentum.
On the topside, immediate resistance is aligned with the 20-day Bollinger upper band at $4,745, where corrective selling could emerge if bulls hesitate to extend the rally. On the downside, initial support is seen near the rising 100-day SMA at $4,380, followed closely by the Bollinger middle band at $4,365, which together form a dense demand zone guarding the recent advance; a deeper pullback would expose the lower Bollinger band at $3,985.14 as a more distant but notable structural floor.

Comments
Log in or sign up to join the conversation.