
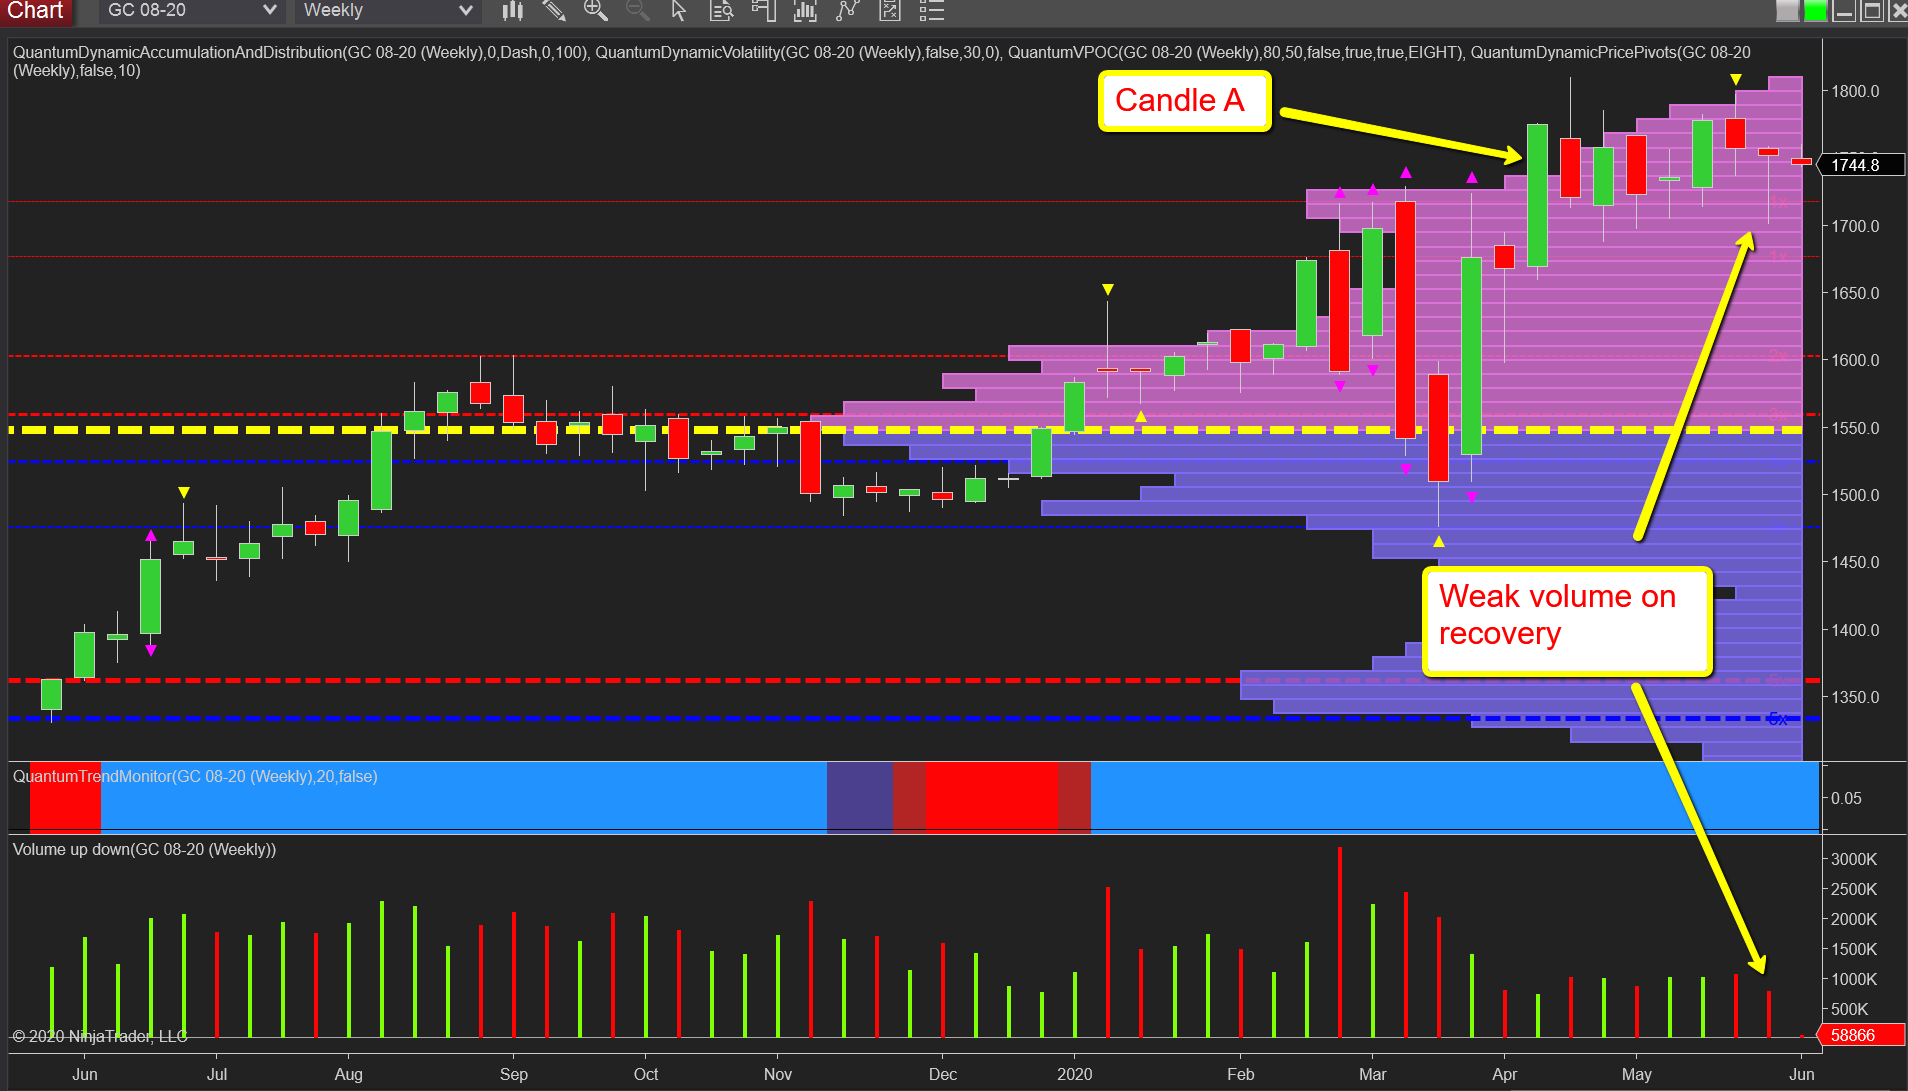
Whilst silver is shining, the same is not true for gold although sentiment remains bullish. However, it is the weekly chart that reveals the current picture and confirms the precious metal is essentially in congestion and has been since mid-April as confirms gold’s attempts to recapture the $1800 per ounce level and move higher with momentum. What is less encouraging, is last week’s price action which saw the metal move lower before recovering to close just off the open and posting a candle with a deep wick to the lower body.
However, the significance here is the volume which looks rather weak in the context of such a strong price move. In this current phase of price action, we have seen this behavior before in particular with the widespread up candle marked as A. This was a clear anomaly on such a strong move signaling the big operators were not participating. So it was no surprise to see the price action that followed.
This push me/pull you price action is a characteristic of gold at present, and until we see volumes increase, we are likely to see further consolidation.
(Click on image to enlarge)

Comments
Log in or sign up to join the conversation.