

Even though we had published warnings, the recent pullback and increased volatility in the precious metals sector have caught many traders and investors off guard. While central bankers keep printing money like crazy, prices for gold and silver have pulled back sharply and have been trading rather sideways to down over the last two and a half weeks.
To help navigate through these uncertain times I decided to publish a somewhat unusual update.
The ultimate success principle: Buy Low and Sell High
If you want to make money in the markets, there is only one very simple yet powerful principle you have to follow: Buy low and sell high. This is the only way to make money and is the most important principle of them all.
You can change the order and first sell high and then buy low, which means you are shorting the market. But, besides that, there is no shortcut or other way to make a gain. This is the most essential thing you need to understand. I am not saying this is easy, but the principle itself is very simple.
However, to figure out if something is high or low, you first need to differentiate in which time frame you are looking at the market. While something might be low on a short-term timeframe (for example, an hourly chart or a daily chart), it still could be very high on a long-term chart (weekly or monthly chart) and vice-versa. Let’s walk through the current set up for gold figuring out the different time frames and assessing whether gold is high or low.
Gold in US-Dollars, Monthly Chart: Rather high than low
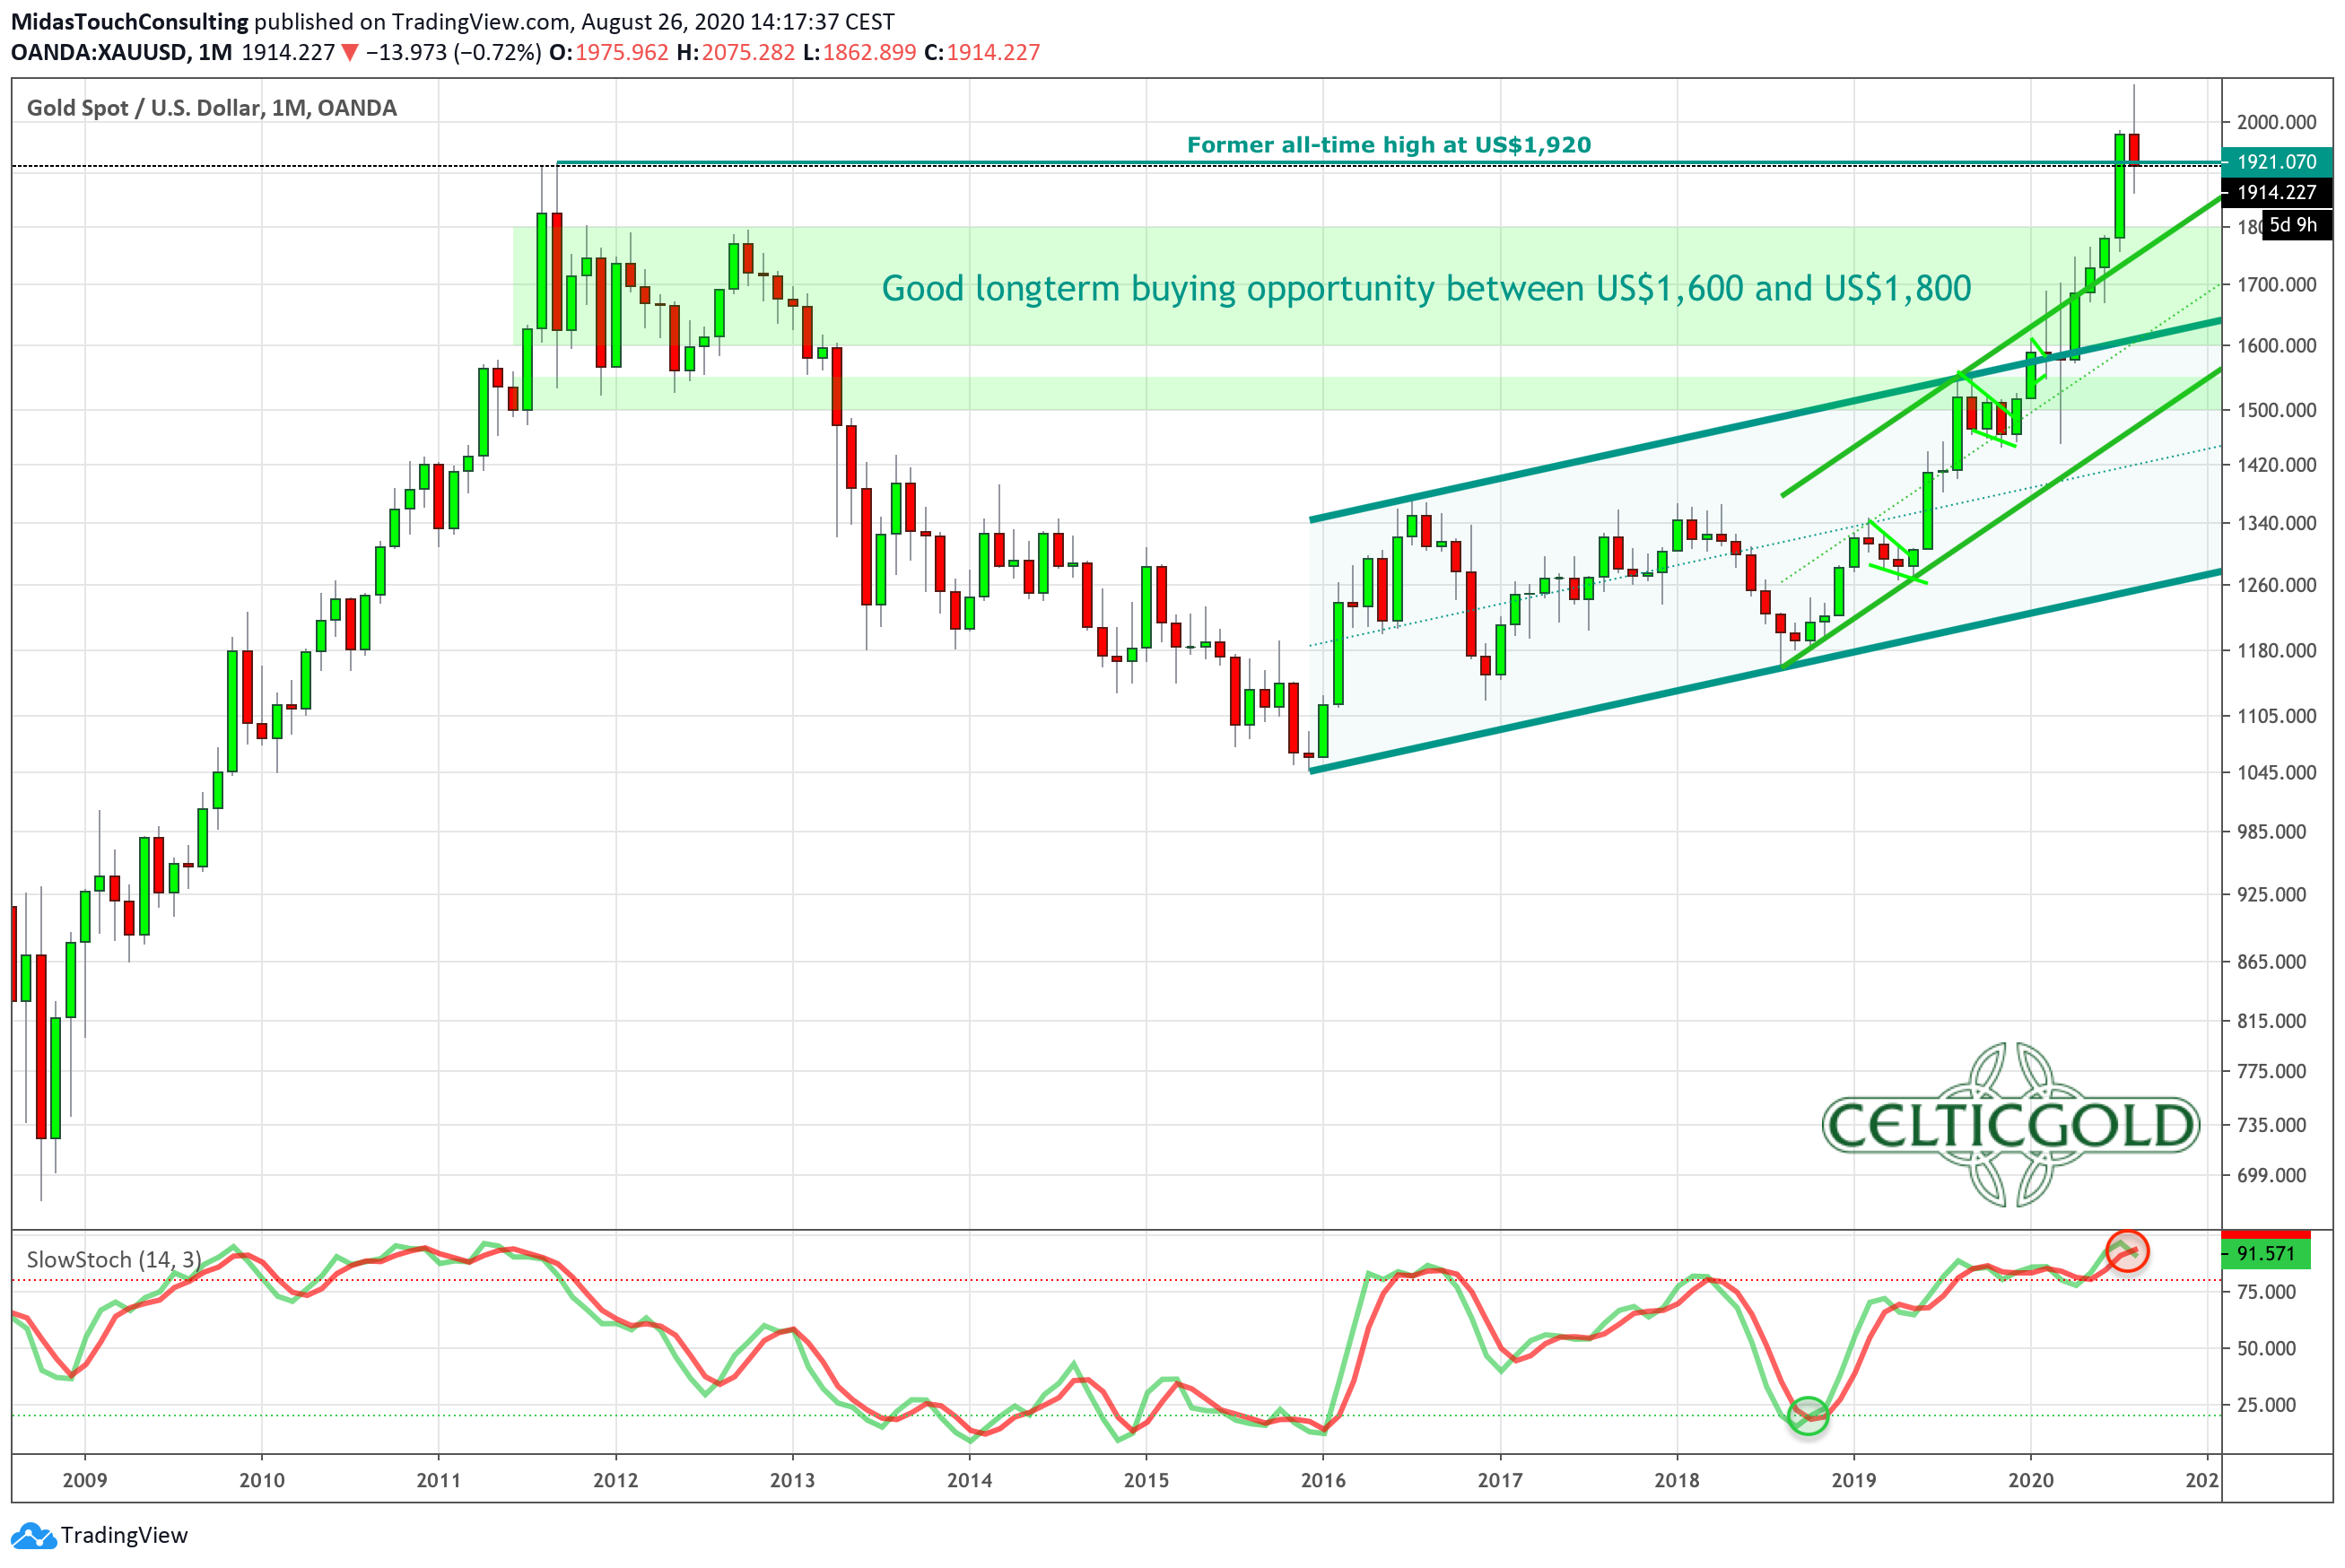
Gold in US-Dollars, monthly chart as of August 26. Source: Tradingview
The monthly chart really is the big picture. If you are a long-term investor with a buy and hold approach, that’s basically your main timeframe. Obviously, things are moving and changing very slowly. It takes time for signals to come up or change. You might get a signal once a year, or maybe only once every decade. And you certainly will be late because changes are showing up late on the monthly timeframe.
However, once a trend is established you can ride it for many years. To your advantage, you also filter out most of the daily and weekly noise and can make life-changing gains by simply playing the long wave. A negative aspect, however, could be that your learning curve is rather slow, as you get only a few signals and might therefore only realize after many years that your strategy or approach has been wrong.
As we talk about gold, I would like to add that the monthly chart, together with the weekly chart, should be your main timing tool for your physical purchases.
On the monthly chart gold is not low
After applying the principle of “buying low and selling high” on the monthly chart for gold, it should be obvious that gold prices are not low anymore. Instead, they have just recently reached a new all-time high, so gold is likely more high than low.
Consequently, it is not the time to chase gold. However, I have to make one exception. Given the dire outlook for all the fiat currency systems on our planet, buying gold at current levels is justified, especially if you don’t have at least 2-5% of your net-worth in physical precious metals already.
In that case, the insurance character of gold and silver is more important than having a good and reasonable entry price. Should you own a physical position in precious metals, on the other hand, then I believe you should patiently wait for lower prices in the weeks and months to come. As a simple rule of thumb, I would say that pullbacks into the zone between US $1,600 and US $1,800 would qualify for a medium good “buy low” opportunity.
Gold in US-Dollars, Weekly Chart: Rather high than low, too.
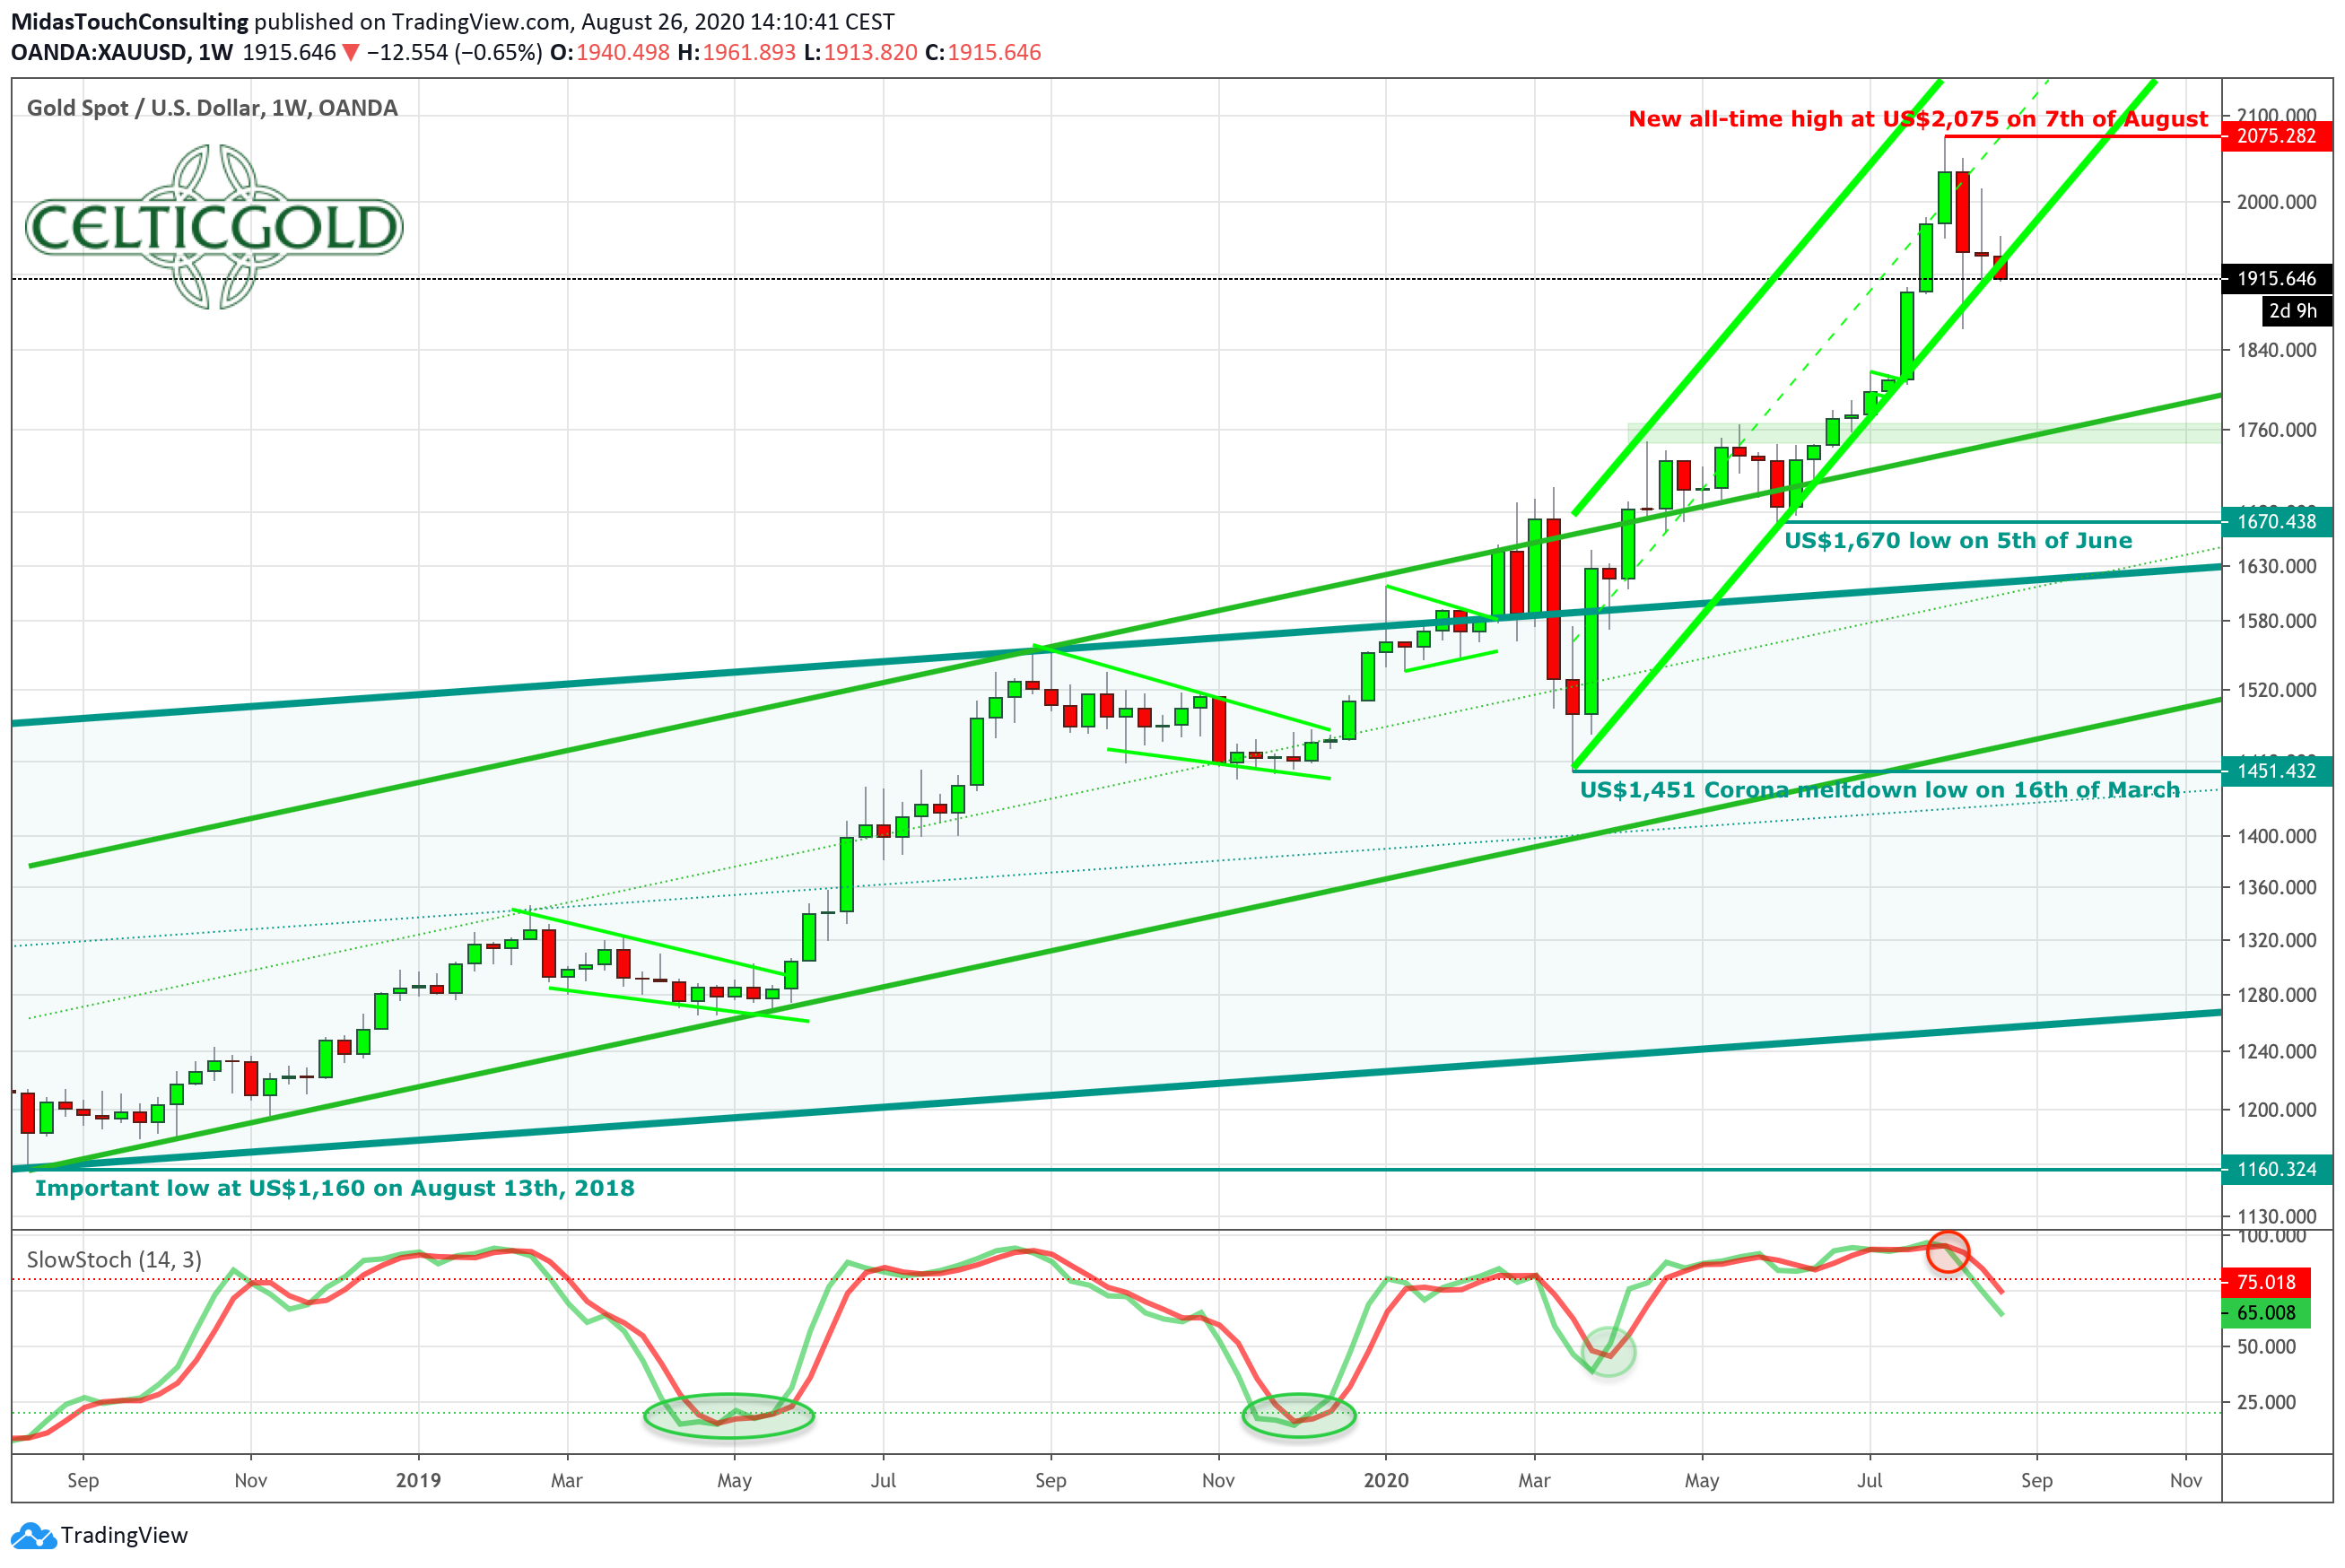
Gold in US-Dollars, weekly chart as of August 26. Source: Tradingview
The weekly chart is not only important for long-term investors, but should also be used by swing traders who want to be in positions for a few weeks to a few months. This is also a great tool to see the bigger picture, and it lets you spot trends and trend-changes much earlier than the monthly chart.
In the case of gold, the weekly chart is up nearly US $900 since the last important low, which was found on August 26 in 2018. In the meantime, gold has rallied from US $1,160 up to US $2,075. Hence, the weekly chart is also high, rather than low.
You can see how the rally accelerated in three trend channels, of which the light green one is the steepest. Should this light green trend channel break, gold might test the upper edge of the next lower trend channel between US $1,750 and US $1,800.
Note that after staying in the overbought zone for more than three months, the stochastic oscillator has finally issued a sell signal. Therefore, the bullish momentum has been lost on the weekly chart. The weekly chart would probably signal a new “buy low” opportunity once the stochastic oscillator reaches its oversold zone or becomes neutral, at least.
The last time this happened was at the “Corona low” in the middle of March. A truly oversold opportunity was last seen in December of 2019. On this weekly chart, you can also see that gold gave you two good “buy low” entries in 2019 and one medium good “buy low” entry in 2020 so far. Hence, one very good “buy low” opportunity should at least show up in the remaining course of this year.
As seen so often in investing and trading, you need to be patient and let the market come to you.
Gold in US-Dollars, Daily Chart: Neither low nor high
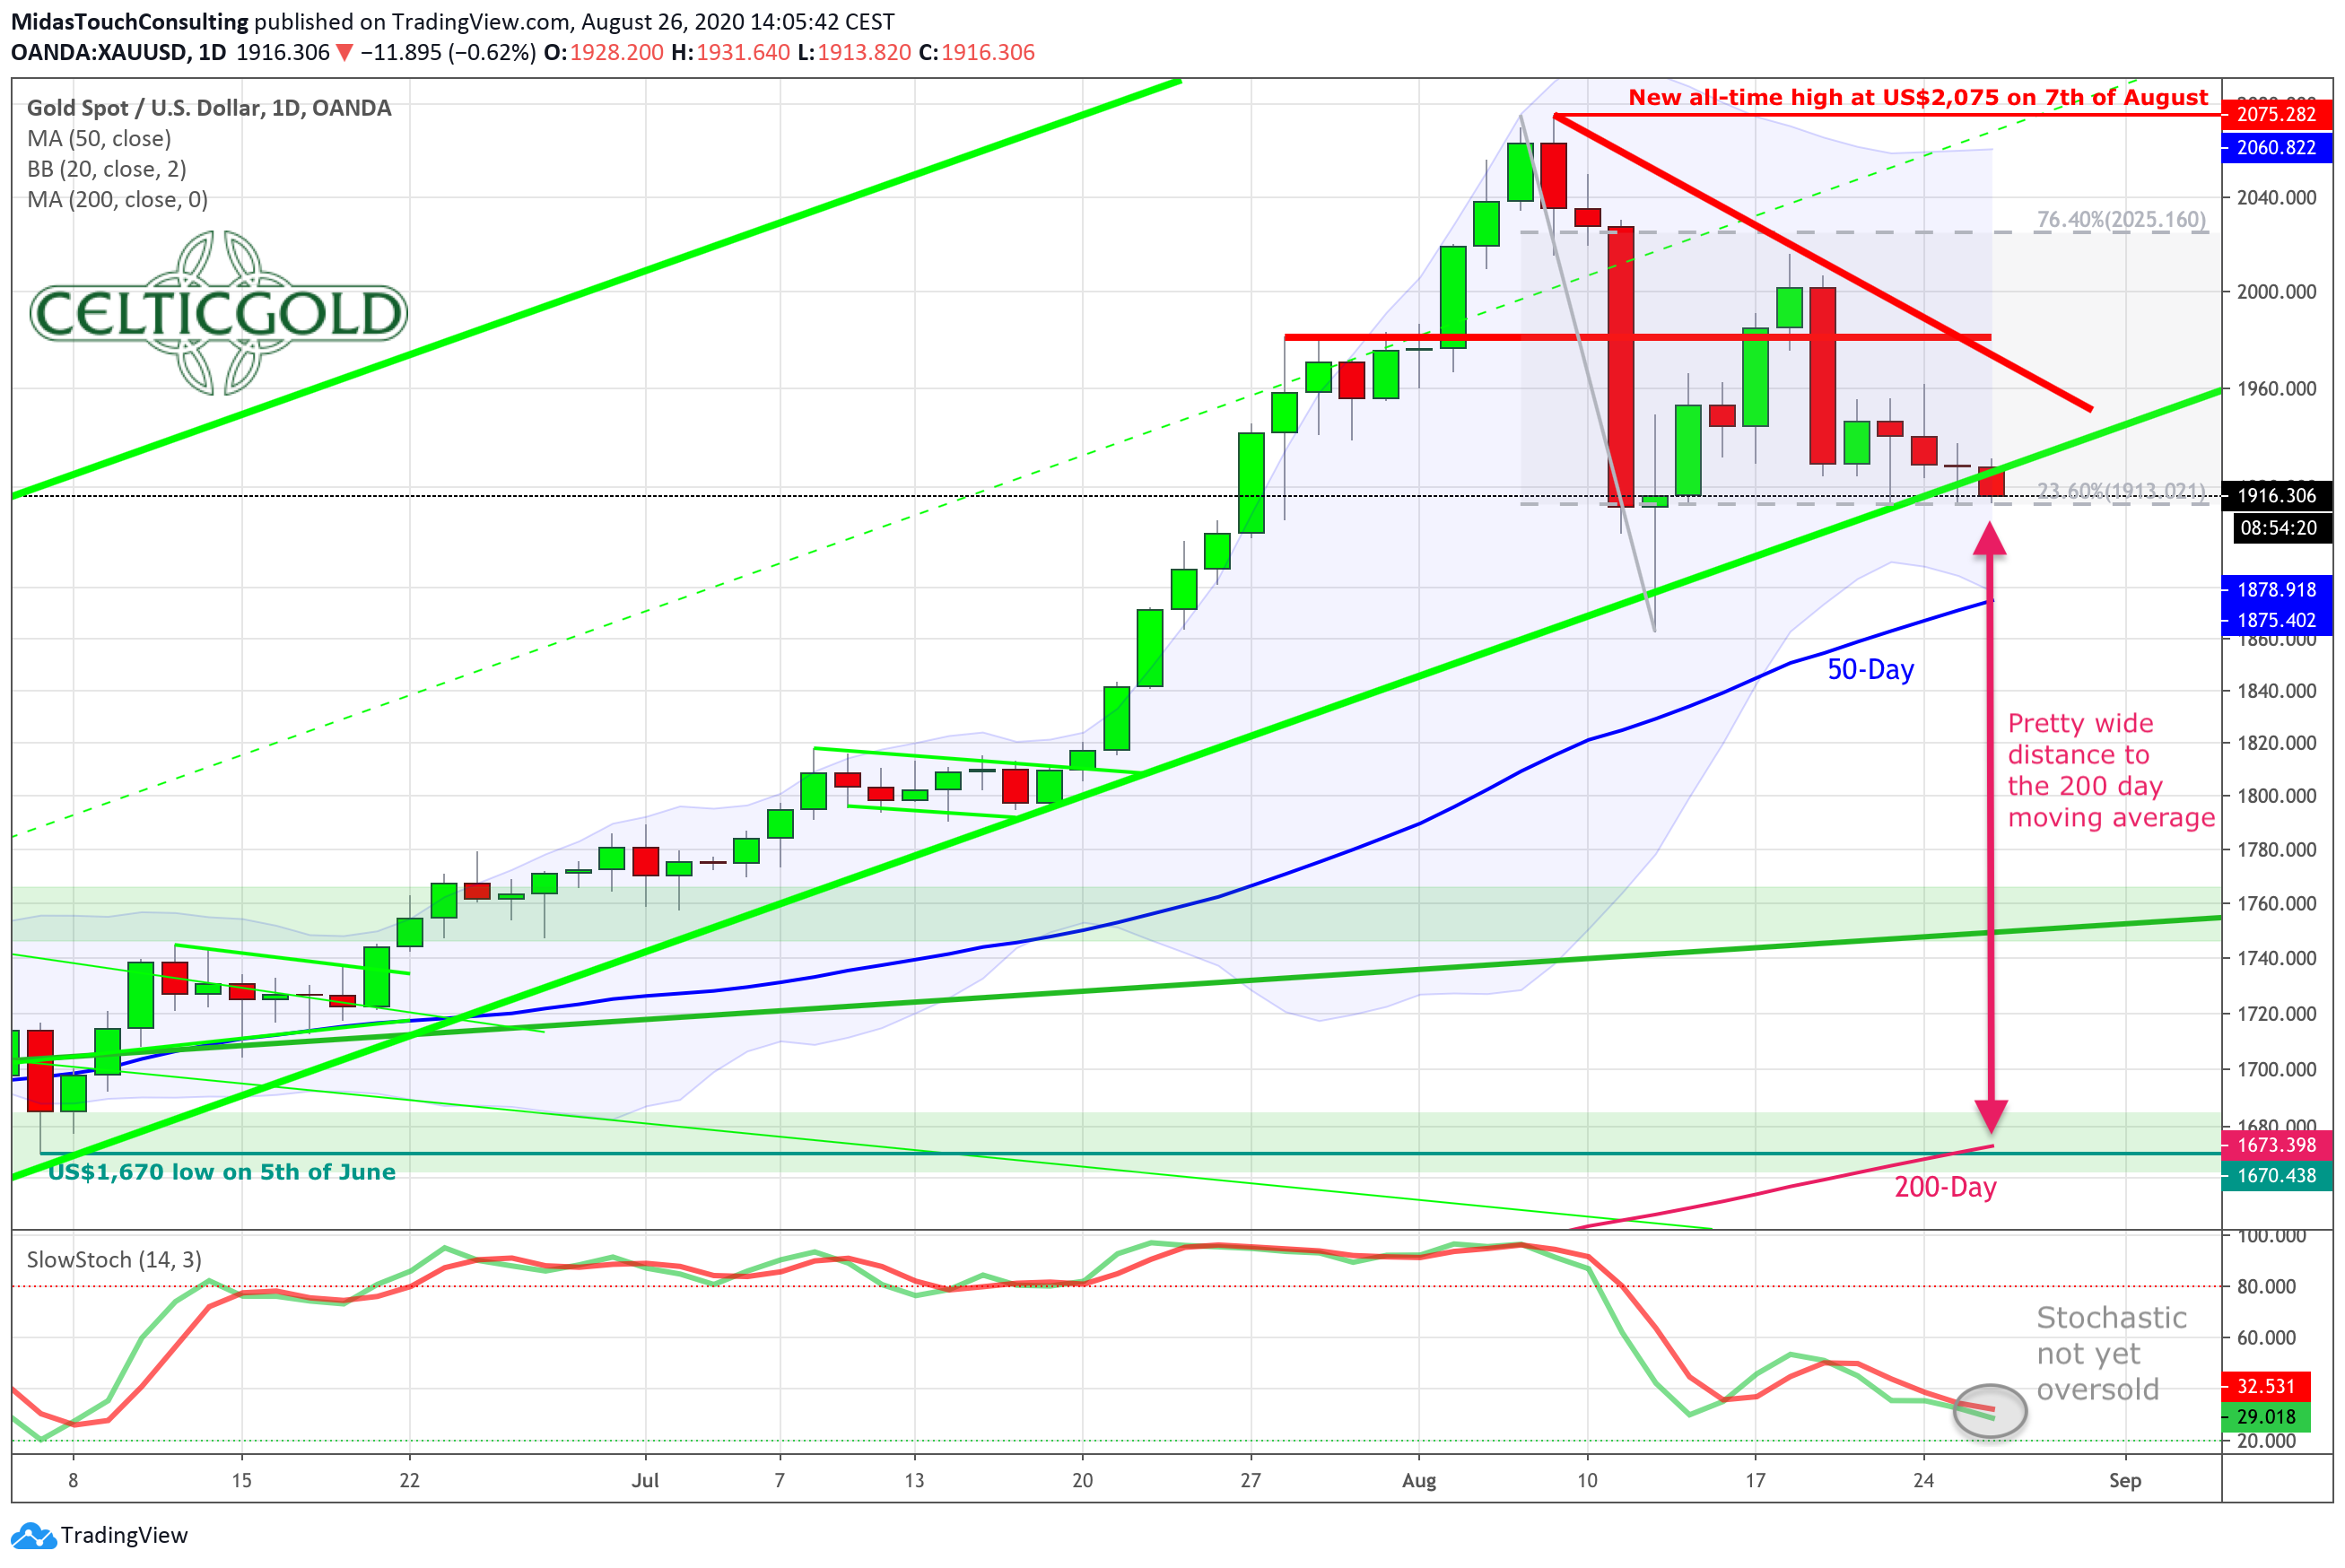
Gold in US-Dollars, daily chart as of August 26. Source: Tradingview
The daily chart is an important timeframe for day-traders and swing traders, but mid- and long-term investors should also use it to optimize their entry and exit timing. On the daily chart, a lot of noise and short-term fluctuations can easily prevent market participants from seeing the forest for the trees. The faster the movements and the shorter the frequencies, the stronger the impact emotions can suddenly have on your decision-finding process.
Looking at the daily chart for gold, after peaking at US $2,075 and now trading nearly US $160 lower, current price levels do not really qualify as being high anymore. However, the most recent low at US $1,861 is also still US $50 away. Hence, the daily chart is neither low nor high at the moment.
Instead, gold is more or less trading in a sideways range, probably trying to find a short-term bottom. Therefore, it´s not really a buy on the daily chart and certainly not a sell, which means it´s rather neutral.
Gold in US-Dollars, Four-hour Chart: Getting low
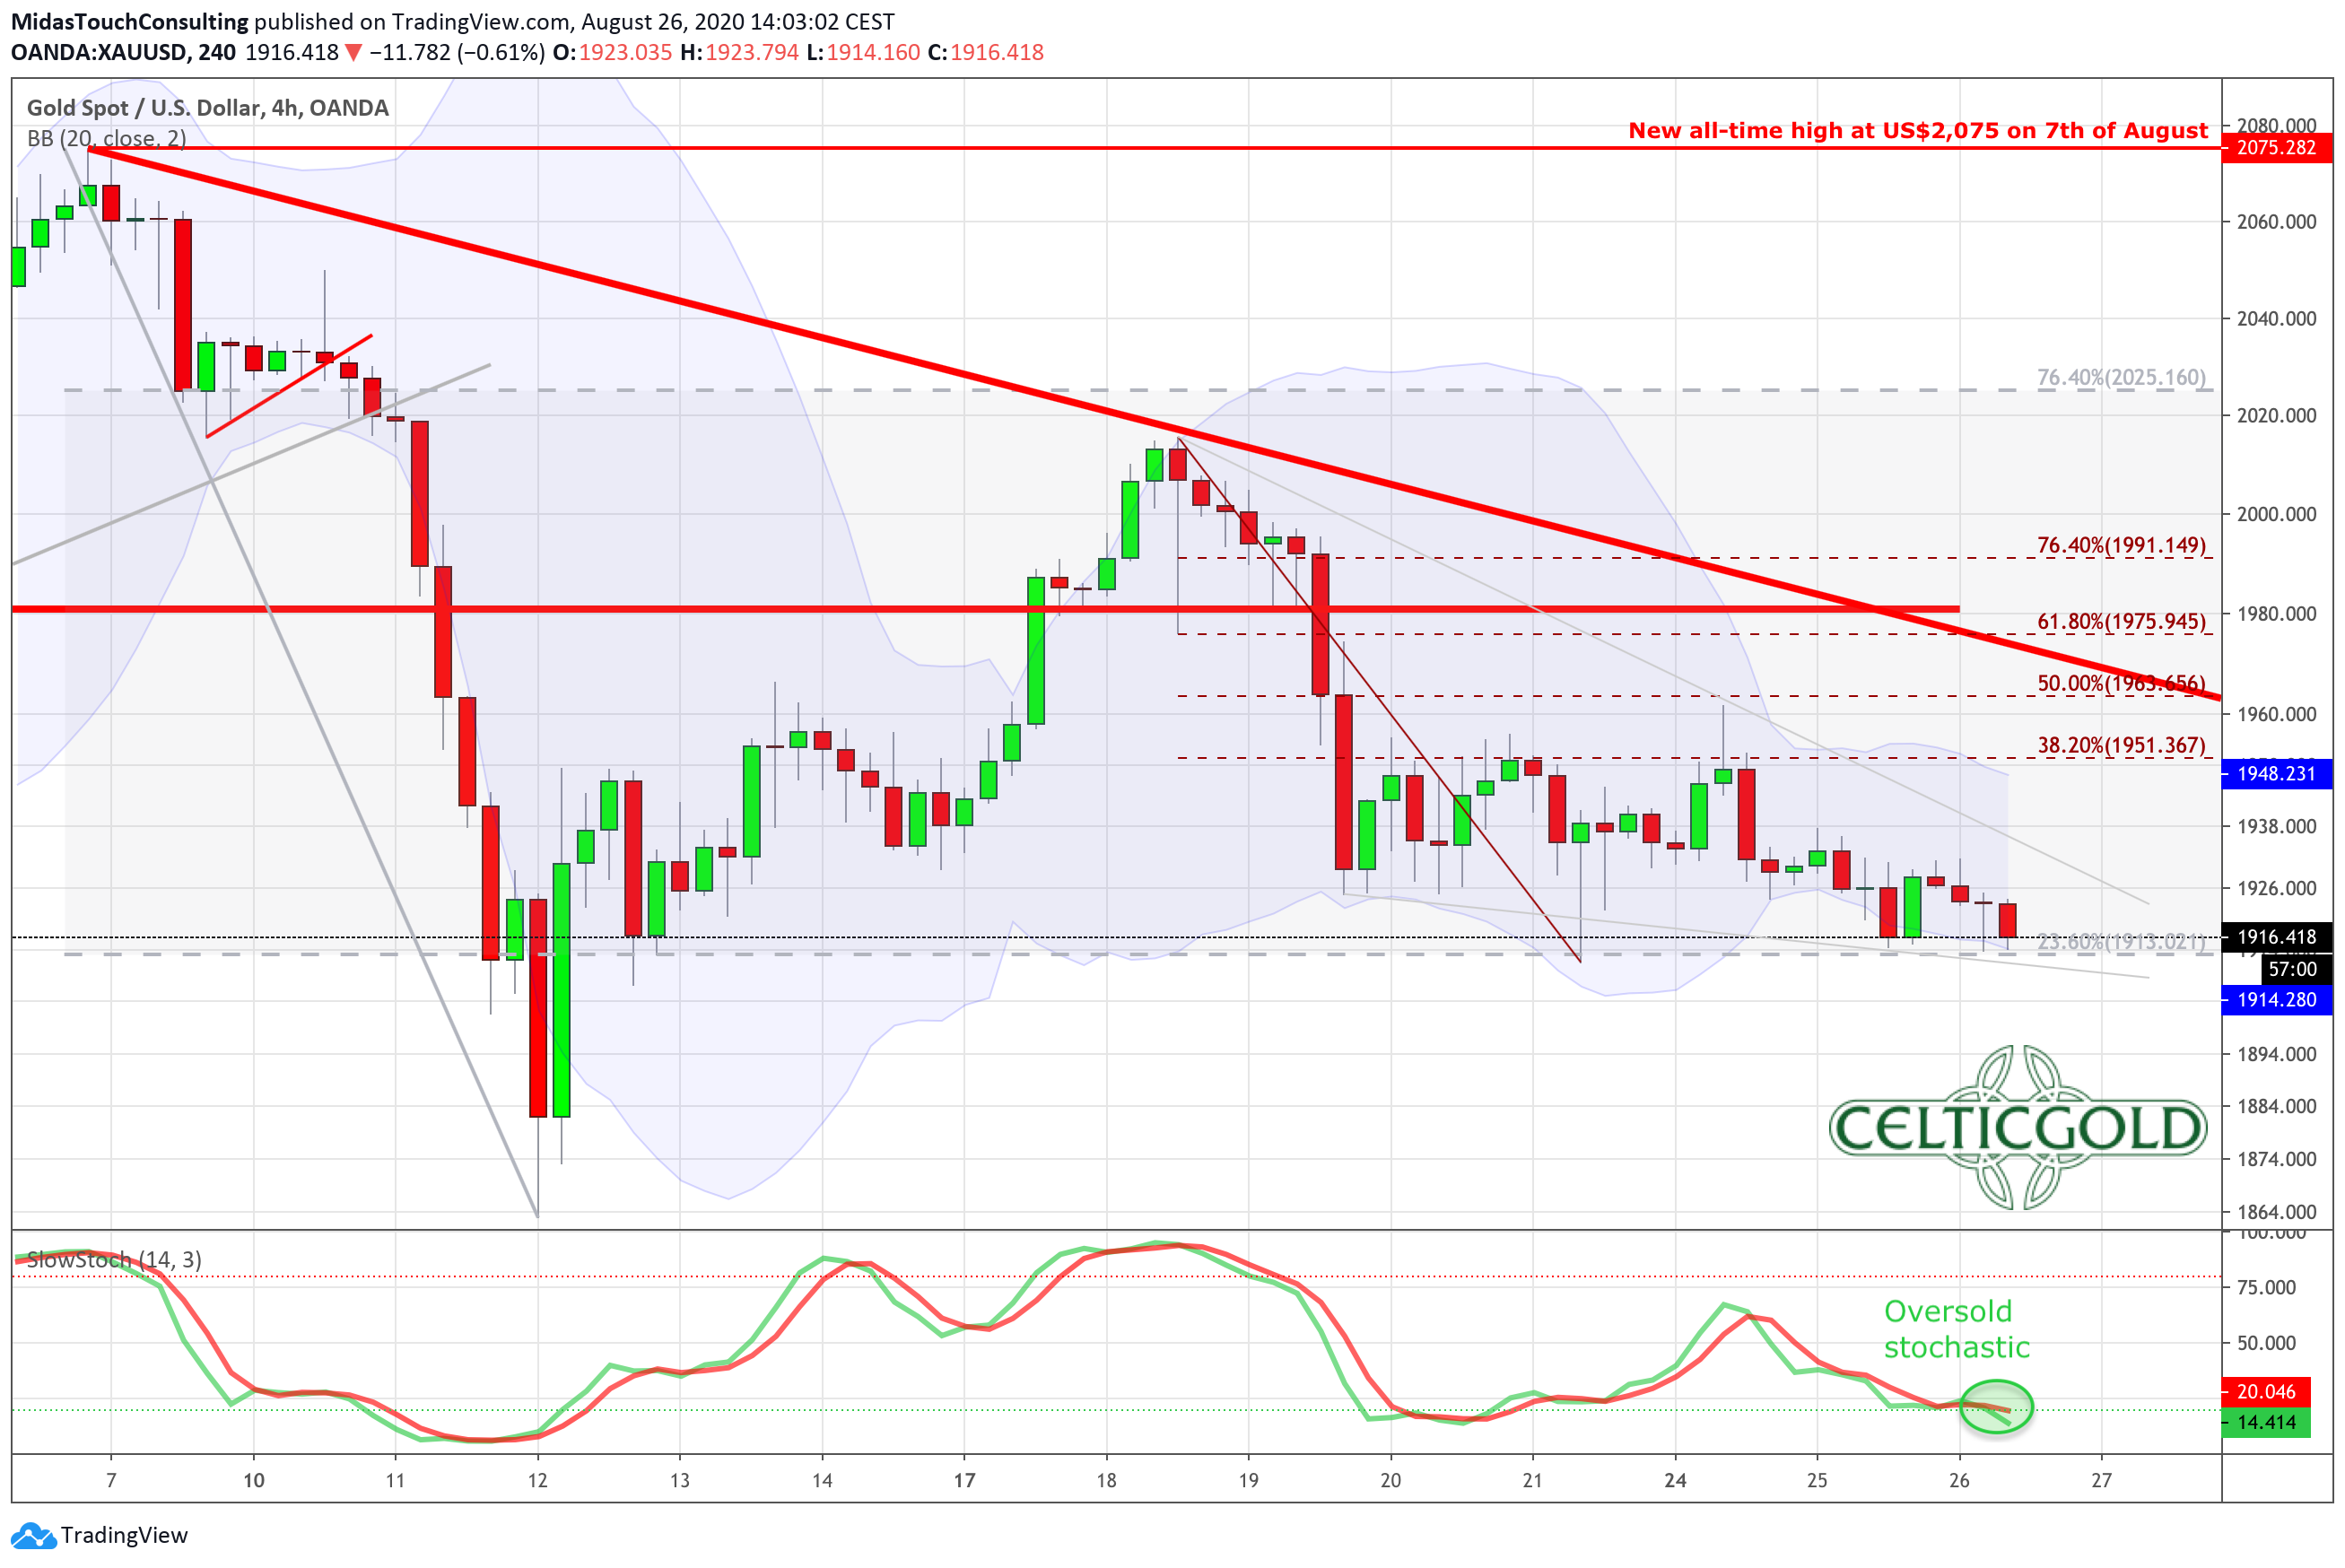
Gold in US-Dollars, Four-hour chart as of August 26. Source: Tradingview
The final stage we want to zoom in on is the four-hour chart. Day-traders, of course, will need to zoom in much further. But for our purposes in this analysis, it is more than sufficient. As you can see, gold has been slowly sliding to the south over the last three trading days. So far, no short-term bottom is in place.
However, bears are only slowly making progress. The sluggish stochastic is signaling an oversold setup, but could move further into its oversold zone. At the same time, the zone between the all-time high at US $1,920 and the round psychological number of US $1,900 should bring in some form of support.
Conclusion and Recommendation: Gold – Technical Update Regarding Buy Low
Going through all the different timeframes, you can see that they are all sending different messages. Ideally, they would all sound the same melody which would mean we could stack our odds and act accordingly by building positions that we could hold for quite some time. Unfortunately, that is not the case at the moment, as the monthly chart simply argues to be patient, while the weekly chart seems to be just starting to roll over.
Therefore, any short-term buying opportunity on the daily, and especially on the four-hour chart, should only be treated as such – a short-term trading opportunity with a short-term time horizon. Large physical purchases, for example, are certainly not in that category.
Buy and hold mining stock strategies would also not really fit into that category. Option plays with a multi-week timeframe are not making any sense in the current non-directional environment. Actually, any multi-week directional plays probably will not be successful on the long side.
But you could try playing a bounce in gold and silver prices for a few days (from around US $1,900 to maybe US $1,950/US $1,970). Although you might need to risk more than US $40 if you want to use the recent low at US $1,961 as your technical stop. At the same time, the upside would be probably limited to US $50 – US $80. In total, this will not give you a very good risk reward ratio.
My humble conclusion would be to avoid this market for some time and simply wait for the next low risk setup. Between US $1,750 and US $1,820, I think a good longer-term opportunity could present itself for a nice swing-trade, as well as for investments into mining stocks and physical purchases of gold and silver.


Comments
Log in or sign up to join the conversation.