


Gold price (XAU/USD) rebounds to around $4,010, snapping the two-day losing streak during the early Asian session on Tuesday. The precious metal edges higher as easing oil prices temper inflation concerns ahead of this week’s US Federal Reserve (Fed) meeting.
Oil prices tumble amid hopes of easing hostilities between the US and Iran. CNBC reported that Saudi Arabia’s Defense Minister held talks with Iranian leaders in Tehran on Monday in an effort to ease simmering tensions between the two countries. This development offered some relief to inflation concerns, though the reprieve may prove temporary.
“There’s been a bit of a pullback in crude oil, which is helping gold, while some bargain-hunting is also coming in,” said Bob Haberkorn, senior market strategist at StoneX. “I think it’s going to be light trading here and we’re going to hang around the $4,000 level into the Fed announcement to see what they have to say,” Bob added.
All eyes will be on the Fed interest rate decision on Wednesday. The US central bank is widely expected to leave interest rates unchanged in a range of 3.75% to 4.00% at its upcoming October meeting following September’s hike.
Markets are now pricing in around 10% odds that the Fed will raise rates by another quarter point at its meeting on Wednesday, according to the CME FedWatch tool. Nearly 82.3% expect at least one hike by year-end.
Gold bull case tested as CTAs lean short around key $4,000 level
According to TD Securities, “the long-term gold bull thesis faces a test near the $4,000/oz level, with CTAs now short across all signals.” The bank notes that “CTAs have already been heavy sellers in gold, with systematic funds firing short across all momentum indicators,” leaving positioning skewed to the downside as prices probe this key threshold.
Against this backdrop, TD Securities points out that “spot and futures pricing has traded below the key $4,000/oz level; however, the market has again shown signs of being extremely resilient with prices recovering in fairly short order.” They add that “despite the near-term easing of ETF flows, the trend remains supportive, while central bank demand has been a key upside driver, particularly when prices are within this territory.”
In terms of positioning dynamics, TD Securities highlights that “CTAs would start to cover shorts north of $4,092/oz,” suggesting that a sustained move above that level could trigger short-covering and potentially reinforce the still broadly supportive backdrop for gold.
Warsh flags investment surge and AI focus but avoids pre-committing on Fed path
Fed Chair Warsh’s speech scores 5.6/10 on the FXS Speechtracker, modestly below the 6.1/10 historical average, pointing to a slightly less impactful tone relative to the established baseline despite broadly steady messaging. The acknowledgment of being “over-scarred from the global financial crisis” underscores a cautious bias even as Warsh highlights structural growth and an investment surge driven by “good policies,” while refusing to prejudge upcoming October and December meetings and stressing spillover dynamics between US policy and the rest of the world. Warsh’s emphasis on AI as a near-term demand-side force and a tool to improve data confidence, alongside a focus on financial stability and tail risks, reinforces a risk-aware stance that is supportive of sustained policy vigilance rather than an immediate shift in the Fed reaction function.
The FXS Fed Sentiment Index was unchanged, moving 0.00 points to a level of 127.51, signaling that the speech left the perceived policy stance firmly in hawkish territory. The combination of a steady, elevated index reading and a slightly softer FXS Speechtracker score suggests markets see no material recalibration of the Fed’s hawkish bias, with Warsh’s caution and focus on investment and AI framed as consistent with an ongoing preference for maintaining tight conditions.
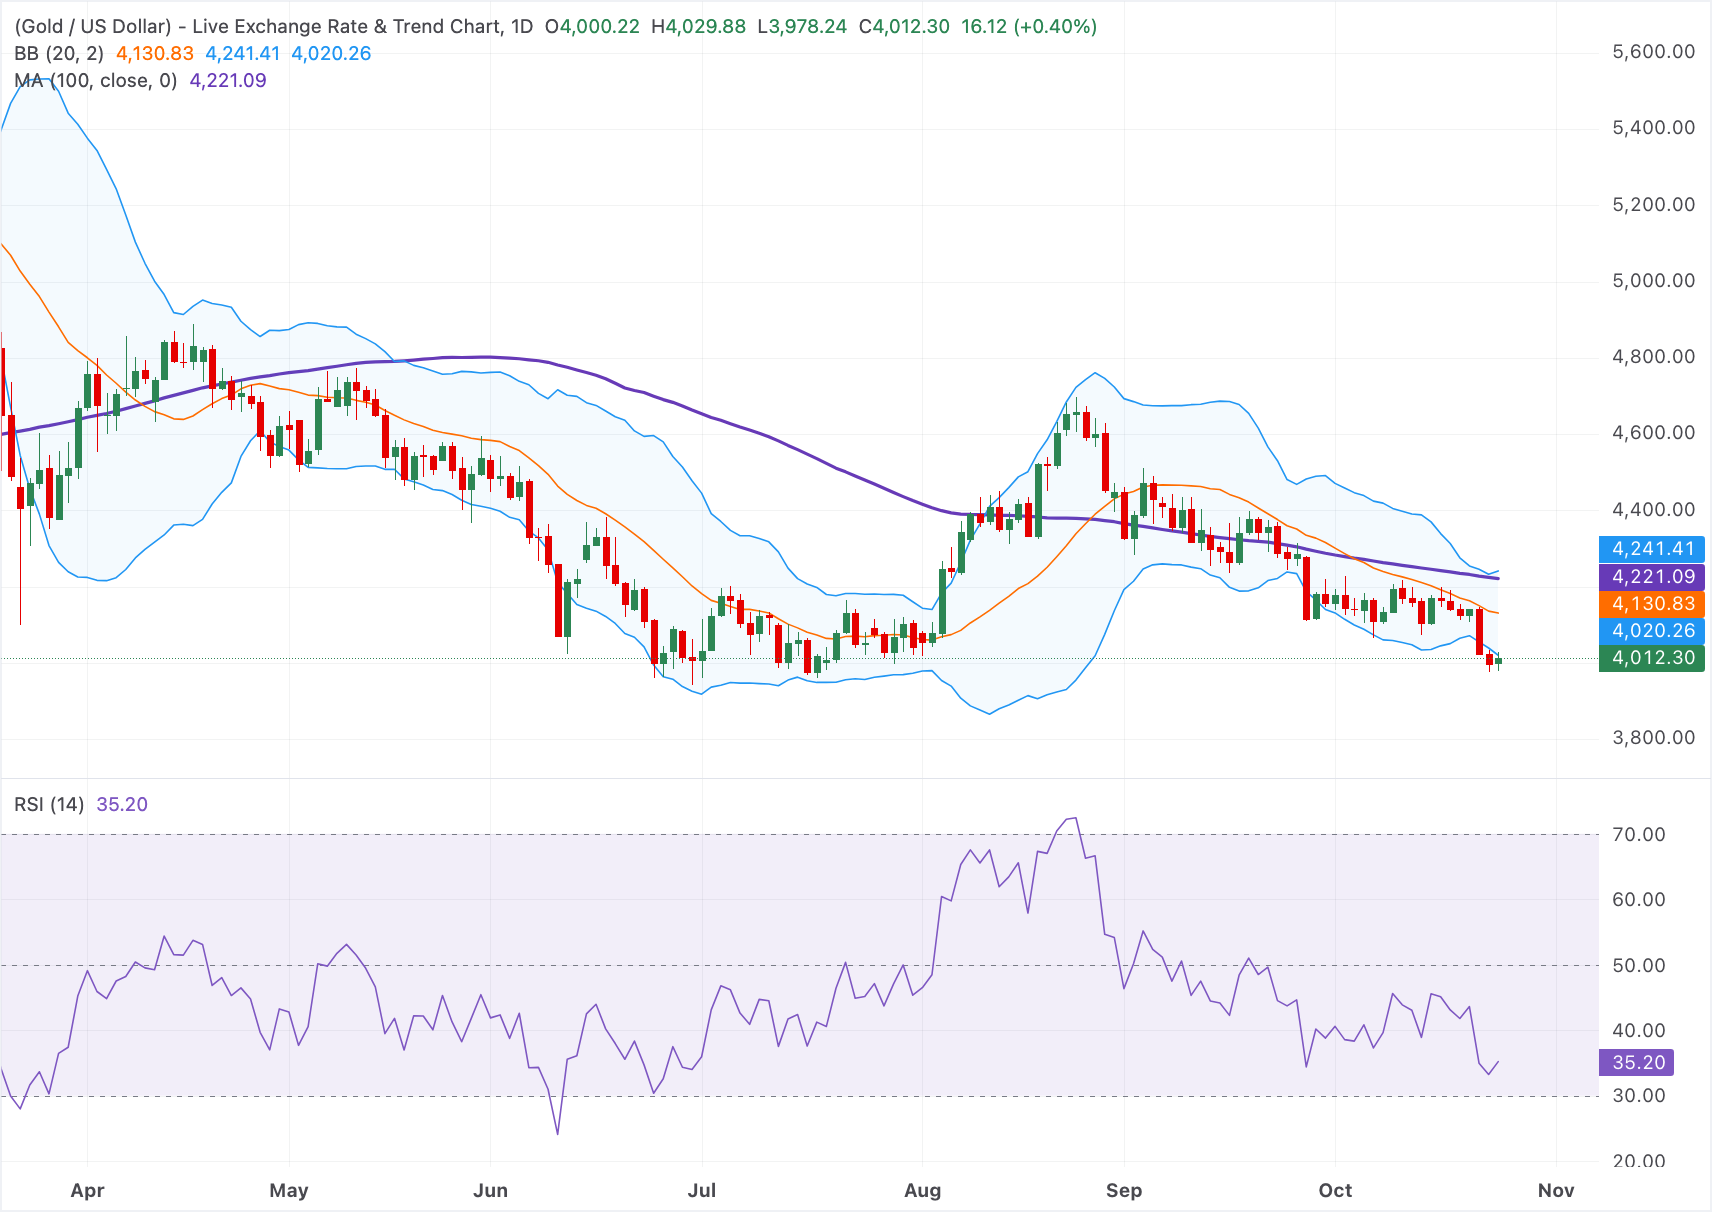
Technical Analysis: Gold retains a negative outlook under the 100-day SMA
In the daily chart, the near-term bias of XAU/USD is bullish as spot holds well above the 100-day simple moving average (SMA) and the 20-day Bollinger middle band, keeping the broader uptrend intact despite the latest consolidation. Price also sits over the lower Bollinger band, suggesting downside moves remain buffered, while the Relative Strength Index (RSI) at 35.20 drifts toward oversold territory, hinting that selling pressure may be losing momentum rather than signaling a trend reversal.
On the downside, immediate support is clustered around the lower Bollinger band at $4,020, followed by the Bollinger midline near $4,130 and the 100-day SMA at $4,220, which together define a dense demand zone underpinning the bullish structure. With no nearby resistance levels flagged by the current indicator set, any rebound from this support area could see buyers attempting to reassert control toward recent highs, as long as daily closes remain above the $4,020 technical floor.



Comments
Log in or sign up to join the conversation.