


Gold (XAU/USD) retreats from its highest level since June 5, touched earlier this Tuesday, and slides back below the $4,400 mark heading into the European session. Despite Friday's weak US Nonfarm Payrolls (NFP) report, traders are still pricing in the possibility that the US Federal Reserve (Fed) will raise borrowing costs by the year-end amid inflation risks stemming from volatile oil prices. This, in turn, is seen as a key factor driving flows away from the non-yielding bullion.
In the latest developments surrounding the Middle East crisis, Iran ruled out any future negotiations with US President Donald Trump and said that it will wait until his term ends on January 20, 2029, to resume talks, dampening hopes for the reopening of the Strait of Hormuz. Furthermore, traffic through the Bab el-Mandeb Strait remains choked due to the Iran-backed Houthis' blockade against Saudi Arabia. This led to the overnight sharp rise in crude oil prices and fueled inflation fears, underpinning prospects for a more hawkish Fed.
The outlook, in turn, remains supportive of elevated US Treasury bond yields, which is seen lending support to the USD and exerting pressure on the non-yielding yellow metal. Traders now look forward to the release of the US Consumer Price Index (CPI) and the Producer Price Index (PPI) on Wednesday and Thursday, respectively, for more cues about the Fed's future policy path. The crucial data will play a key role in influencing the near-term USD price dynamics and providing some meaningful impetus to the Gold price.
Apart from this, further developments surrounding the Middle East crisis might continue to infuse volatility across global financial markets and contribute to producing trading opportunities around the XAU/USD pair.
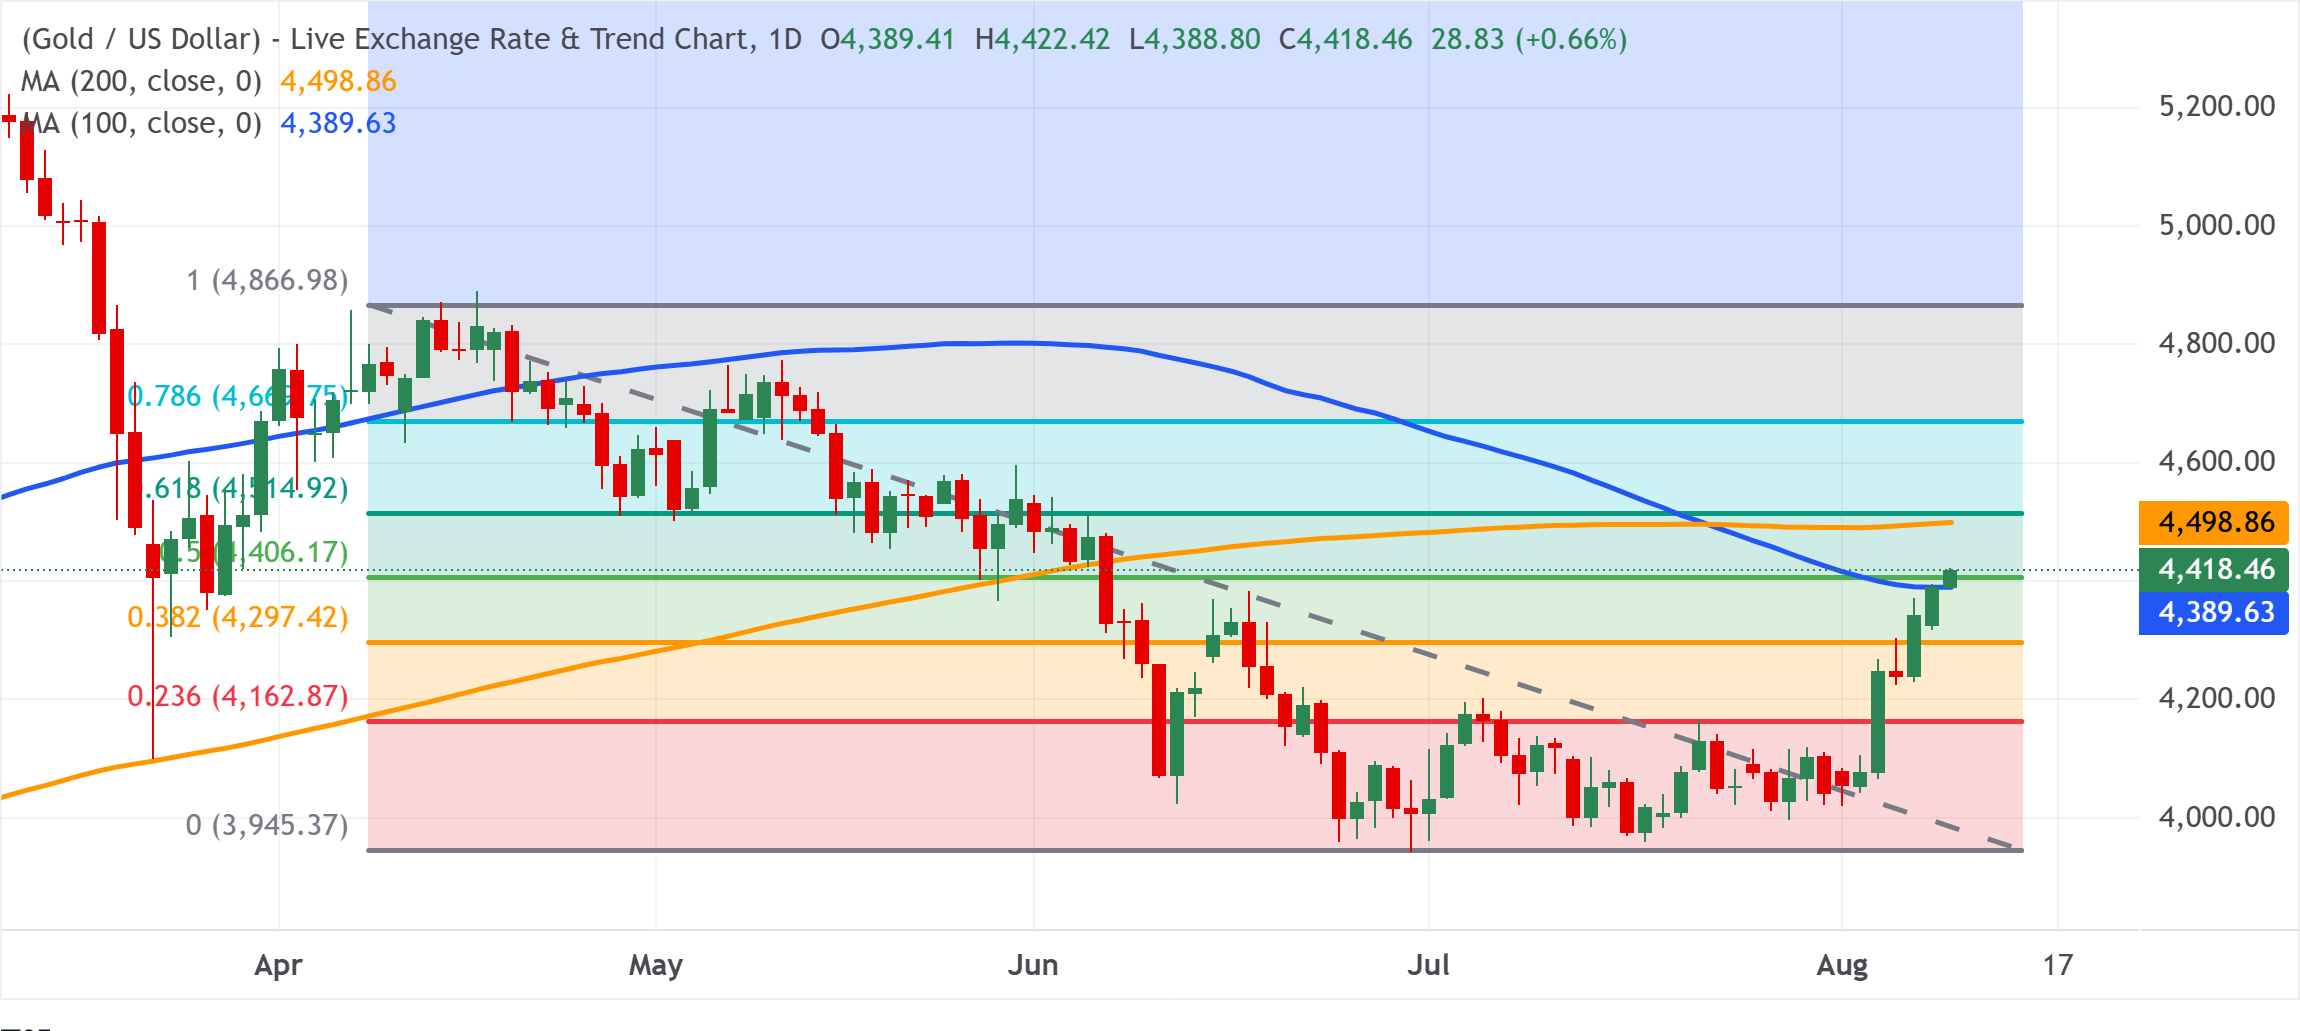
XAU/USD daily chart
Technical Analysis
An intraday breakout through the 100-day Simple Moving Average (SMA) and the 50.0% Fibonacci retracement of the April-June fall suggest that buyers retain control. Momentum indicators also back this constructive structure. The Relative Strength Index (RSI) is hovering just below overbought territory at 68.89, and the Moving Average Convergence Divergence (MACD) histogram is expanding in positive territory. This, in turn, suggests persistent upside pressure while the Gold price remains capped beneath the 200-day SMA at $4,498.
The next relevant hurdle is pegged around the 61.8% Fibo. retracement at $4,514.92, where a break would open the way toward the 78.6% retracement at $4,669 and the cycle high around $4,866.98. On the downside, a deeper pullback would expose the 38.2% retracement at $4,297 and then the 23.6% level at $4,162, ahead of the structural floor near $3,945.


Comments
Log in or sign up to join the conversation.