
Gold prices edged higher as the US Dollar declined, weighed down by cross-currency flows emanating from sharp gains in GBP/USD and later AUD/USD. The former move followed an offer from UK Prime Minister May to take a cross-party approach to Brexit while the latter seemed to be triggered by upbeat economic data as well as hopes for an imminent breakthrough is US-China trade talks.
Crude oil prices rose for a fourth consecutive day, shrugging off API data saying that inventories added 3 million barrels last week. The move seems to reflect hopes for tightening supply after OPEC continues to slash output. Bloomberg data showed that the cartel supplied 30.38 million barrels per day in March, the least since January 2015. Ongoing supply disruption in Venezuela might have been supportive too.
The markets seem primed for risk-on day ahead, with bellwether S&P 500 futures pointing convincingly higher. That seems to bode well for cycle-geared crude oil prices. Gold may languish even as ebbing haven demand hurts the US Dollar as a coincident rise in bond yields caps gains. In any case, follow-through may be limited absent a lead from US-China trade negotiations resuming in Washington DC.
Sentiment swells linked to recent advances on this front have notably failed to be sustained ho, ever. Meanwhile, a steady stream of Eurozone and UK PMI readings as well as the US service-sector ISM survey might revive global slowdown fears if the outcomes echo the recent tendency toward disappointment on macro-economic news flow, cooling risk appetite.
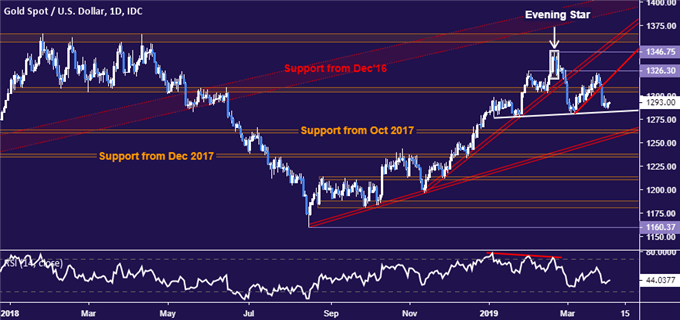
GOLD TECHNICAL ANALYSIS
Gold prices still look to be carving out a bearish Head and Shoulders top formation. A daily close below neckline support at 1282.91 would confirm the setup, initially exposing the next downside threshold in the 1260.80-63.76 area. Alternatively, a push back above the 1303.70-09.12 zoneputs resistance at 1326.30 back into focus.
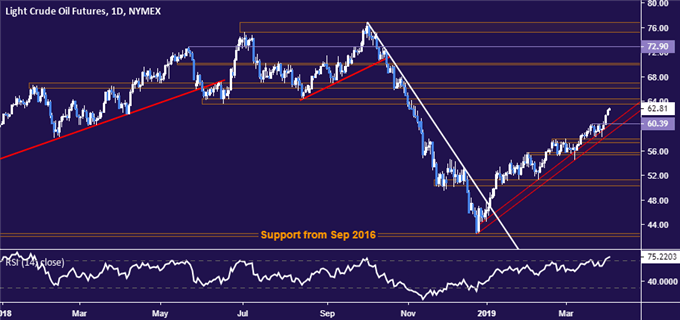
CRUDE OIL TECHNICAL ANALYSIS
Crude oil prices rose to the highest level in five months, with buyers now taking aim at support-turned-resistance in the 63.59-64.43 area. A daily close above that targets the 66.09-67.03 inflection zone. Support begins at 60.39 but a convincing reversal needs a break below rising trend support set from late December, now at 58.92.


Comments
Log in or sign up to join the conversation.