

Global risk assets are taking a hit again on Thursday, with US equity markets making little progress after the open while crude oil prices declined in line with a drop with US Treasury yields. The persistent drumbeat of the US-China trade war has made for a difficult investing and trading environment in the near-term, given the propensity for information to emerge seemingly at random with no rhyme or reason.
One asset that has made little sense to market participants in recent weeks has been gold. Rising uncertainty around the US-China trade war negotiations has proved bullish for safe-haven assets like the Japanese Yen and US Treasuries, but amid a return of US, Dollar strength has effectively neutralizing bullion’s safe-haven appeal (at least in USD-terms).
In thinking about gold’s role as a safe haven asset, recall the recent relationship between gold prices and gold volatility: GVZ peaked on May 13, and gold prices hit their monthly high the following day; as gold volatility dropped back towards its all-time low, the gold price breakout from earlier this month failed.
GVZ (GOLD VOLATILITY) TECHNICAL ANALYSIS: DAILY PRICE CHART (MAY 2018 TO MAY 2019) (CHART 1)
(Click on image to enlarge)

But a curious development has happened in recent days: despite Gold 1-month implied volatility (as measured by GVZ) hitting a fresh all-time closing low yesterday, May 29, Gold prices have not followed suit and turned lower themselves. Whereas rising volatility is usually seen as a disconcerting development for asset prices in general, Gold benefits from rising volatility: higher levels of uncertainty increase the safe haven appeal of Gold.
If gold prices are going to hold up in the face of declining gold volatility, then it stands to reason that gold prices may be finding a base themselves. Having remained in the former range carved out between 1266.18 and 1288.58 from April 15 to May 13, gold prices may be coiling for a move higher yet.
GOLD PRICE TECHNICAL ANALYSIS: DAILY CHART (APRIL 2018 TO MAY 2019) (CHART 2)
(Click on image to enlarge)

As the gold price coil continues, the near-term forecast is neutral; the breakout lingers but is not in play yet. It thus still holds that should gold prices move above 1288.58, we would again be looking at topside break of the consolidation as well as the downtrend from the February and March 2019 highs, while, a drop below 1266.18 would constitute a downside break of the consolidation as well as the uptrend from the late-2018 swing lows.
IG CLIENT SENTIMENT INDEX: SPOT GOLD PRICE FORECAST (MAY 30, 2019) (CHART 3)
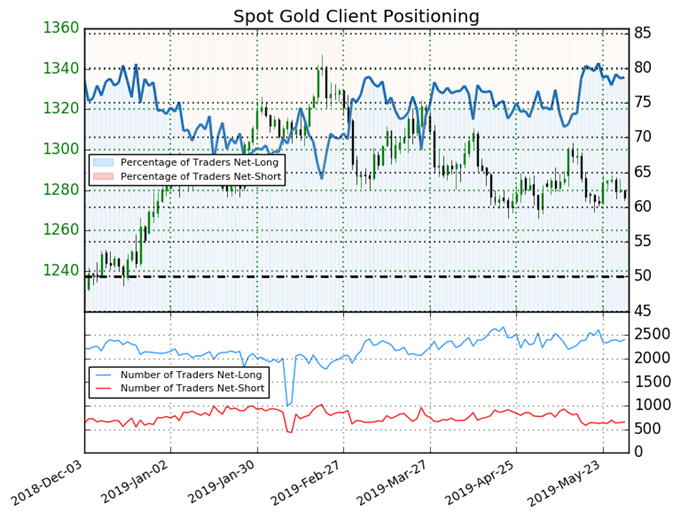
Spot gold: Retail trader data shows 78.7% of traders are net-long with the ratio of traders long to short at 3.69 to 1. The number of traders net-long is 0.4% lower than yesterday and 9.0% lower from last week, while the number of traders net-short is 4.2% higher than yesterday and 5.2% higher from last week.
We typically take a contrarian view to crowd sentiment, and the fact traders are net-long suggests spot gold prices may continue to fall. Yet traders are less net-long than yesterday and compared with last week. Recent changes in sentiment warn that the current spot gold price trend may soon reverse higher despite the fact traders remain net-long.



Comments
Log in or sign up to join the conversation.