

Gold prices mostly idled Friday despite a weaker US Dollar, consolidating the highs of the prior day’s spirited advance unable to muster substantive follow-through. Crude oil prices edged up a bit in what looked to reflect a broader retracement across sentiment-geared assets following Thursday’s dramatic selloff.
GLOBAL TRADE WAR ESCALATION RISK IN FOCUS
Looking ahead, holiday trading closures in the UK and the US might make for a quiet start to the trading week. The much-anticipated European Parliament elections seem to have passed without incident, at least for now. News-flow informing global trade war escalation fears may yet trigger knee-jerk volatility, however.
US President Trump is visiting Japan to discuss a range of issues including bilateral trade relations with Prime Minister Abe. Meanwhile, a meeting of EU trade ministers will address upcoming negotiations with the US on industrial tariffs and a still-possible levy on auto imports.
While no major policy announcements are expected from either meeting, the tone of outgoing commentary might inspire a response. If they portend greater scope for cross-border tensions, gold may edge higher as crude oil weakens in risk-off trade.
GOLD TECHNICAL ANALYSIS
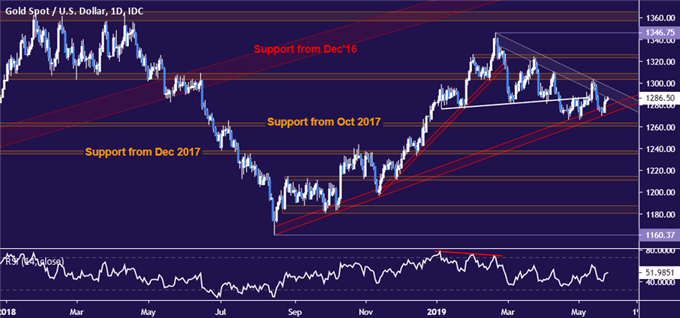
Gold prices are probing resistance guiding them lower since late February. A daily close above its outer layer – now at 1297.13 – likely neutralizes near-term selling pressure and exposes the 1303.70-09.12 congestion region. Alternatively, a daily close below the 1260.80-63.76 zone may signal a bearish trend change, opening the door for a test of 1235.11-38.00 next.
CRUDE OIL TECHNICAL ANALYSIS
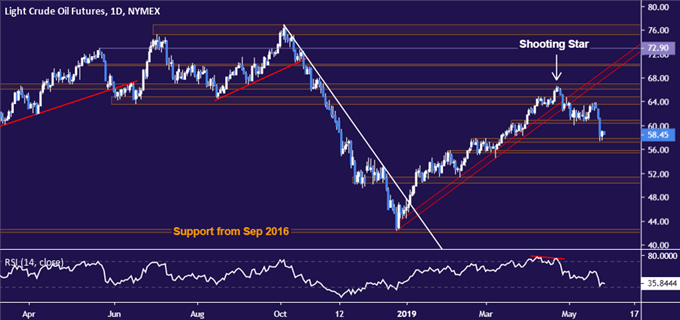
Crude oil prices paused to digest losses at support in the 57.24-88 area. A further push lower from here sees the next downside hurdle in the 55.37-75 zone. Alternatively, a daily close back above the 60.39-95 region brings the dense 63.59-67.03 resistance block back into focus.



Comments
Log in or sign up to join the conversation.