
Gold prices have caught a bid to move back above the psychological 1300 level, and this comes after Gold prices spent more than a week building a base of support at a key zone on the chart. This zone of support runs from the 38.2% Fibonacci retracement of the August 2018 - February 2019 bullish move; and extends up to 1285.90 which is the 61.8% retracement of the 2013-2015 major move.
This same support zone has already come into play a few times already in 2019 trade; helping to set higher-low support in early-January before Gold prices rallied up to a fresh 10-month high. This zone came back into play in early-March and was key in a bullish breakout strategy that was setting up ahead of the FOMC rate decision. And now after the April test, this zone has held three different support inflections in Gold prices for 2019.
GOLD PRICE DAILY CHART
(Click on image to enlarge)
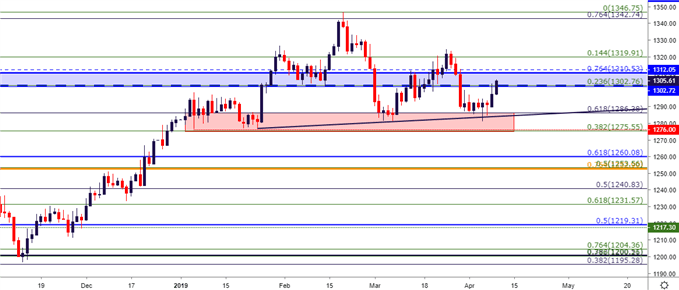
Chart prepared by James Stanley
GOLD TESTING POTENTIAL RESISTANCE ZONE
At this point, Gold price action is trading in a zone of prior support taken from a couple of other Fibonacci levels. The 23.6% retracement of the same August 2019 – February 2019 run exists at 1302.76, and at 1310.53 is the 76.4% retracement of the 2014-2015 major move. This zone was a key component of the breakout strategy investigated in Gold ahead of the March FOMC rate decision. That setup played out in a fairly-clean manner in the immediate aftermath of the FOMC, as prices quickly ran up to the initial target around 1319.91. But – bulls couldn’t maintain and prices soon reverted right back to that longer-term support from 1275-1286.
The March swing high was a lower-high from the February move, and this brings the sustainability of the longer-term theme of strength in Gold prices into question.
GOLD PRICE FOUR-HOUR CHART
(Click on image to enlarge)
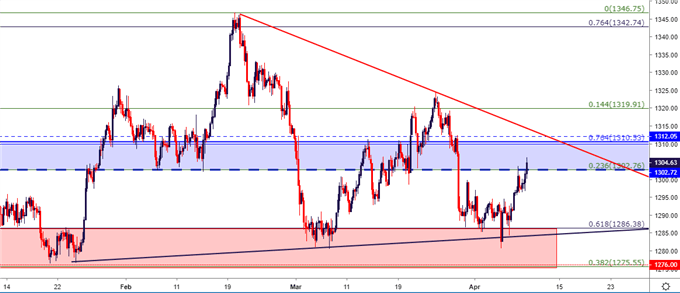
Chart prepared by James Stanley
WILL GOLD RALLY BREAK OR FOLD AHEAD OF ECB, FOMC MEETING MINUTES?
Last month’s flare of strength in Gold prices started after the ECB rate decision in the early portion of the month. And that theme ran in a clean manner until just after the FOMC rate decision, at which point the US Dollar ran into a big area of support and started to rally. That strength in the US Dollar through the Q1 open and into the Q2 close helped to push Gold prices back-down to 2019 support.
But now that a dovish Fed is built into expectations, the big question is whether Gold bulls can continue to drive-higher on the charts; and with some context, taking the recent show of lower-high resistance combined with the prior bullish move, and there would be a bull pennant formation that traders can work with. This can, at the very least, provide an element of directional bias to the matter. But – this would also denote the importance of timing as prices are currently trading within a realm of congestion that’s been lackluster for Gold traders of recent.
GOLD PRICE DAILY CHART
(Click on image to enlarge)
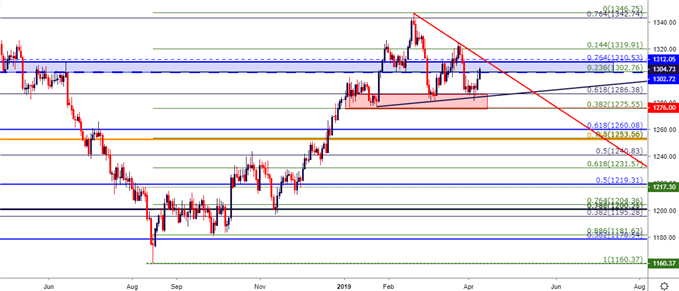
Chart prepared by James Stanley
GOLD PRICE TRADING STRATEGY
Given the current backdrop, traders could investigate bullish strategies should another support inflection come into play off of the zone looked at above that runs from 1275-1286. Alternatively, should prices break-out of the bull pennant, that could re-open the door to bullish continuation strategies, at which point buyers could look to re-orient the current zone of short-term resistance as follow-through support. This runs from the 1302-1310 zone on the chart.
On the other side of Gold prices: The US Dollar is continuing to build an ascending triangle formation, which will often be approached in a bullish manner. As discussed in last Thursday’s webinar, this formation may take some time to fill-in, especially when considering possible drivers to create such a scenario. But – if Gold prices break below the zone of 2019 support, that would likely be a related theme to a US Dollar bullish breakout, and this could soon re-open the door to bearish trend strategies in Gold. Downside targets could be set towards 1260 and then the confluent zone around the 1250 psychological level.
GOLD PRICE EIGHT-HOUR CHART
(Click on image to enlarge)
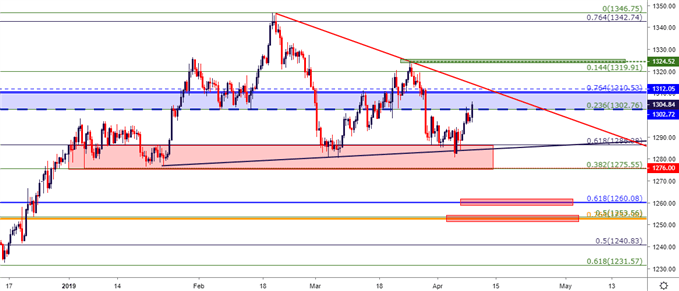
Chart prepared by James Stanley
THE GOLD BACKDROP VIA THE GLD ETF
For American traders without access to CFD’s, the GLD Exchange Traded Fund is a popular way of accessing exposure into Gold. Below, I’ve incorporated the above Fibonacci retracements from the Gold CFD charts looked at above into the GLD ETF, and this shows a fairly-clear set of lines in the sand for both support and resistance. The support zone in GLD that’s continued to hold the 2019 lows runs from 120.91-121.06, while the resistance side of the equation shows from 123.29-123.41, which is currently holding today’s highs. Given the descending trend-line, and the fact that March produced a lower-high, traders would likely want to let the level at 125.11 get tested through before re-opening the door to topside trend continuation scenarios. At that point, current resistance around 123.29-123.41 could be re-purposed as higher-low support.
GLD DAILY PRICE CHART
(Click on image to enlarge)
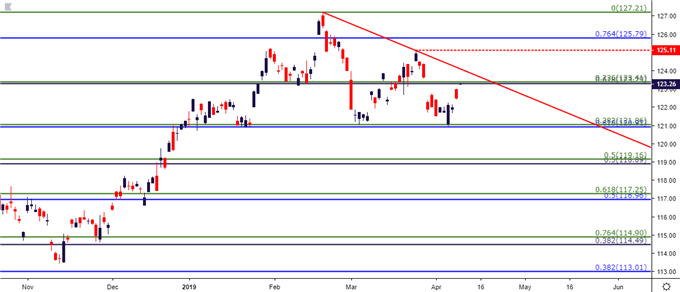
Chart prepared by James Stanley


Comments
Log in or sign up to join the conversation.