


The gold price extended its sharp downward trend, falling to its lowest level since July last year as inflation concerns intensified. The precious metal dropped to $3,995, about 29% below this year’s peak, and formed a death cross pattern, which points to further downside in the near term.
Gold price sinks as crude oil soars
Gold has remained in a bear market in the past few months as inflation concerns have flared. The most recent data showed that the headline Consumer Price Index (CPI) rose 3.7% in September, while the core CPI rose 2.6% in September. Inflation has remained above 2% in the last five years.
US inflation will likely continue rising in the foreseeable future now that oil prices are on an upward trajectory. Brent crude oil prices ended last week at $117.35, while the West Texas Intermediate (WTI) jumped to $103. The two benchmarks have soared by 67% from their lowest levels in July.
As a result, the average gasoline price has jumped to $4.29, while diesel is hovering at its all-time high. Diesel has continued soaring, even after President Donald Trump eased sanctions on Russian diesel exports.
Higher oil prices mean that inflation will remain above the Federal Reserve’s target of 2.0% in the foreseeable future. As a result, the Federal Reserve is unlikely to cut interest rates in the near term.
Economists expect the bank to leave interest rates unchanged in this week’s meeting. Fed’s Chair, Jevin Warsh, has hinted that the bank will not hike this week, but left the door wide open for another hike. Polymarket odds that the Fed will hike rates in December have jumped to over 80%.
On the positive side, gold may benefit if US bond yields continue falling in the coming weeks. The ten-year has dropped to 4.99%, while the two-year has moved to 4.686% from the year-to-date high of 4.95%. Gold tends to perform well when yields are in a downward trend.
Another potential catalyst is the fact that the SPDR Gold Trust GLD has continued adding assets. The fund has added over $430 million in assets in the last 30 days, a sign that bulls expect it to rebound.
Gold price forecast: technical analysis
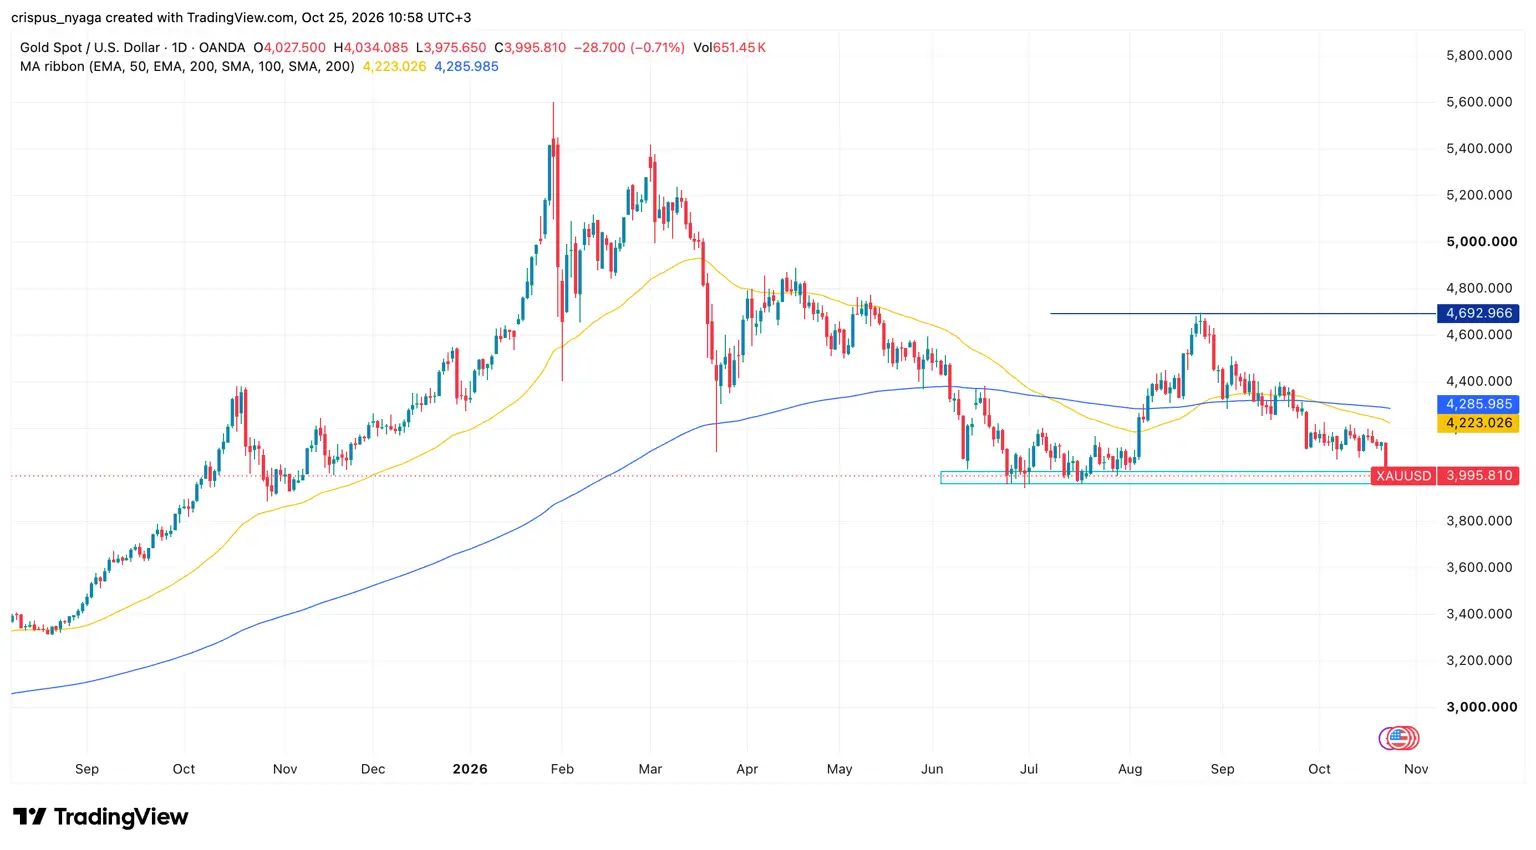
The daily chart shows that gold has come under pressure in the past few months. It has dropped below the important support level of $4,000, a sign that bears are in control.
Gold formed a death cross pattern, which happens when the 50-day moving average crosses the 200-day moving average. In most cases, this pattern normally leads to more downside.
Gold has slumped below the Supertrend indicator, which is a highly bearish sign. Therefore, the price will likely continue falling, potentially to the support level of $3,800. A move above the resistance level of $4,131 will invalidate the bearish outlook.


Comments
Log in or sign up to join the conversation.