

Gold prices continue to exhibit back-and-forth price action after a riveting Q1 to start the year. Gold prices came into 2019 with a full head of steam, rallying all the way above the 1345 level and moving very near the batch of resistance that held last year’s advance in the 1365 region. But, that’s around the point that bulls lost control and prices started to pull back, and after a test of a big support zone that runs from the 1275-1280 area, and a strong ensuing bounce in the final three weeks of March, Gold prices have been in varying forms of consolidation ever since. This marks almost three months of digestion following the aggressive rally that lasted from August of last year into February of this year.
GOLD PRICE WEEKLY CHART
(Click on image to enlarge)
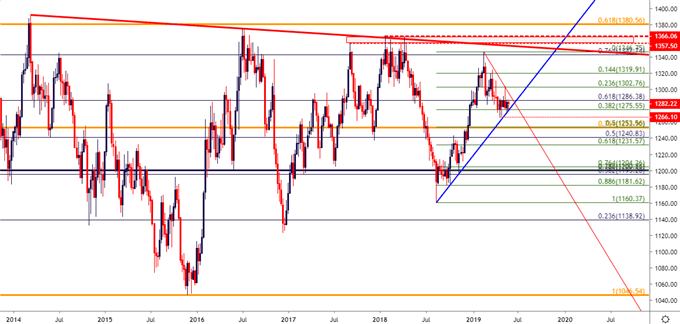
Chart prepared by James Stanley
At this point, prices continue to cling to the 38.2% retracement of that recent bullish move. This comes in around 1275.55; and while there were already multiple tests below this level, bears haven’t been able to retain control. Sellers have twice been thwarted at the 1266.10 level, and that price currently marks the 2019 low in Gold prices. Earlier in May, it looked as though the backdrop may be aligning for bullish continuation scenarios; and buyers were even able to test above the psychological 1300 level. But, resistance showed around 1302.76, or the 23.6% retracement of that same major move, and consolidation has since continued as Gold prices narrow into a tighter range.
GOLD PRICE DAILY CHART
(Click on image to enlarge)
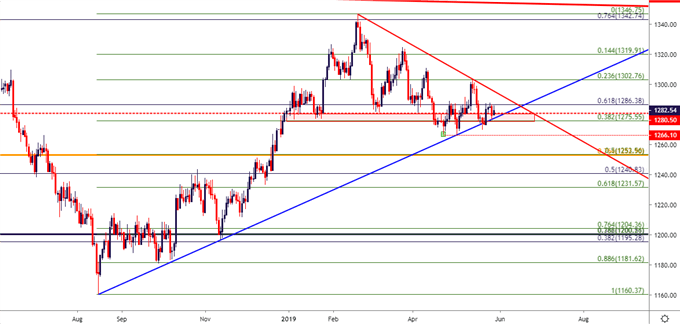
Chart prepared by James Stanley
The May range in Gold prices spans from the early-month low of 1266.10 up to the 1302.76 Fibonacci level, and these prices can help to mark directional themes in the pair. A break-below 1266.10 exposes the 50% retracement from that same Fibonacci study, which is confluent with the 76.4% retracement of the 2011-2015 major move around the 1253 area. If that support is unable to hold, another batch of potential comes into play from the 1231-1240 area, with the former of those prices functioning as the 61.8% retracement of the August-February major move while 1240 is the 50% marker of the 2013-2015 major move.
GOLD PRICE DAILY CHART
(Click on image to enlarge)
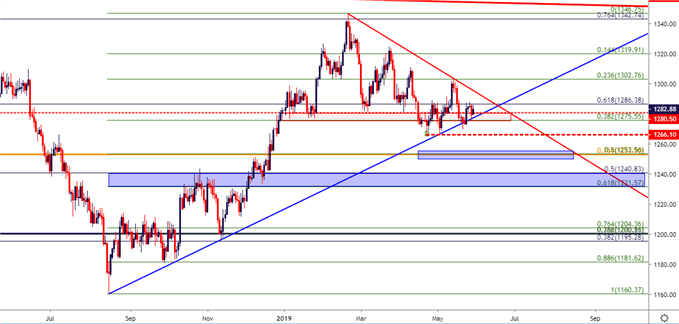
Chart prepared by James Stanley
On the long side of Gold prices, the big question is whether the August-February run has more life left in it as prices have now been pulling back from that theme for more than three months. But, the fact that the 50% marker around 1275 continues to exhibit near-term support after a couple of tests below, the door can remain open to bullish prospects. On a longer-term basis, a break above the May high around 1302 exposes the March high around 1320; which syncs with the 14.4% retracement of the August-February move. Above that, the big zone of resistance from 1350-1365 looms ominously on the chart. The April swing-high around 1310 could offer an interesting spot for an initial scale or perhaps a break-even stop move. On a shorter-term basis, another level of resistance is in play although this has been a messy area on the chart, and that exists at 1286.38, which is the 61.8% retracement of the 2013-2015 move. Over the past week, this level has helped to hold resistance in Gold prices and if bulls are able to evoke a push above, the door could soon open to a re-test of the 1300 area.
GOLD PRICE FOUR-HOUR CHART
(Click on image to enlarge)
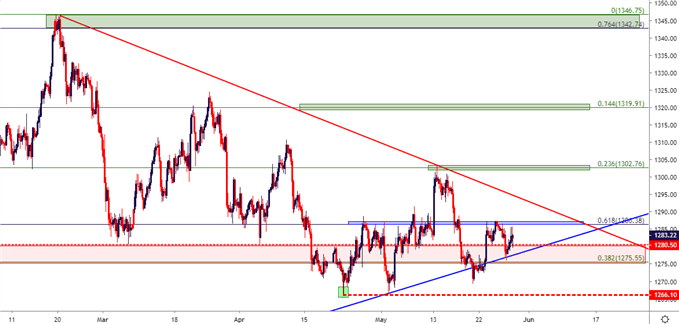
Chart prepared by James Stanley



Comments
Log in or sign up to join the conversation.