
Gold price is off the two-month highs but maintains its bullish momentum, as September highs of $1834 remains in sight. Gold price continues to remain underpinned by the market uncertainty over the next policy move by the Fed after Chair Jerome Powell said they are patient on rate hikes a week ago. The bright metal remains at the mercy of the dynamics in the US dollar and the Treasury yields, as investors await the US inflation data for the next direction in gold price.

Image Source: Pixabay
Gold Price: Key levels to watch
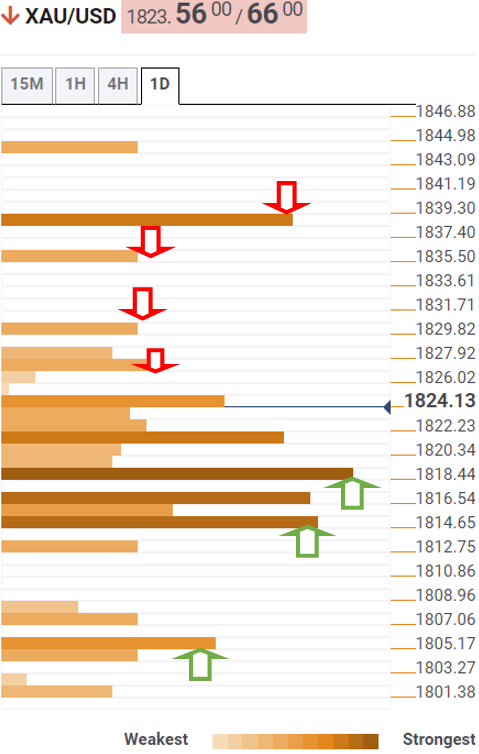
The Technical Confluences Detector shows that the latest leg down in gold price is seen testing strong bids at $1822, which is the convergence of the Bollinger Band one-day Upper and Fibonacci 38.2% one-day.
The immediate downside is guarded by the confluence of the previous week’s high and Fibonacci 61.8% one-day at $1818.
If the selling momentum intensifies, then powerful support around $1815 will be put to test. That level is the intersection of the previous month’s high, pivot point one-month R1 and pivot point one-day S1.
Further south, the Fibonacci 23.6% one-week at $1805 will come into play.
On the flip side, buying resurgence could see a fresh rally back towards the two-month tops of $1827, above which the pivot point one-day R1 at $1830 will get probed.
The next bullish target is envisioned at $1834, September highs. The pivot point one-week R1 at $1839 will offer fierce resistance to gold optimists.
Here is how it looks on the tool
About Technical Confluences Detector
The TCD (Technical Confluences Detector) is a tool to locate and point out those price levels where there is a congestion of indicators, moving averages, Fibonacci levels, Pivot Points, etc. If you are a short-term trader, you will find entry points for counter-trend strategies and hunt a few points at a time. If you are a medium-to-long-term trader, this tool will allow you to know in advance the price levels where a medium-to-long-term trend may stop and rest, where to unwind positions, or where to increase your position size.


Comments
Log in or sign up to join the conversation.