
- Gold’s bullish bias intact as dollar remains less preferred.
- Dovish Fed boosts risk sentiment, capping Gold’s upside.
- A close above 21-DMA is needed for additional gains.
Gold (XAU/USD) builds on Friday’s 1.20% rally and trades near the highest levels in two weeks, as the bulls continue to cheer the Federal Reserve (Fed) Chair Jerome Powell’s dovish stance, which reinforced expectations of low-interest rate regime for an extended period. Although gold appears to lack follow-through as the sentiment on the global equities remains buoyed by the Fed’s dovish narrative.
Despite the struggle, the path of least resistance appears to the upside for the yellow metal, as the US dollar remains less favored against its major competitors, in the wake of the record-breaking rally in the US stocks that contributes to the upbeat market mood. Further, uncertainty about the US fiscal stimulus and rising election risks continue to bode well for gold. Meanwhile, the technical outlook also remains constructive after last week’s upsurge.
Gold: Daily chart
Short-term technical perspective
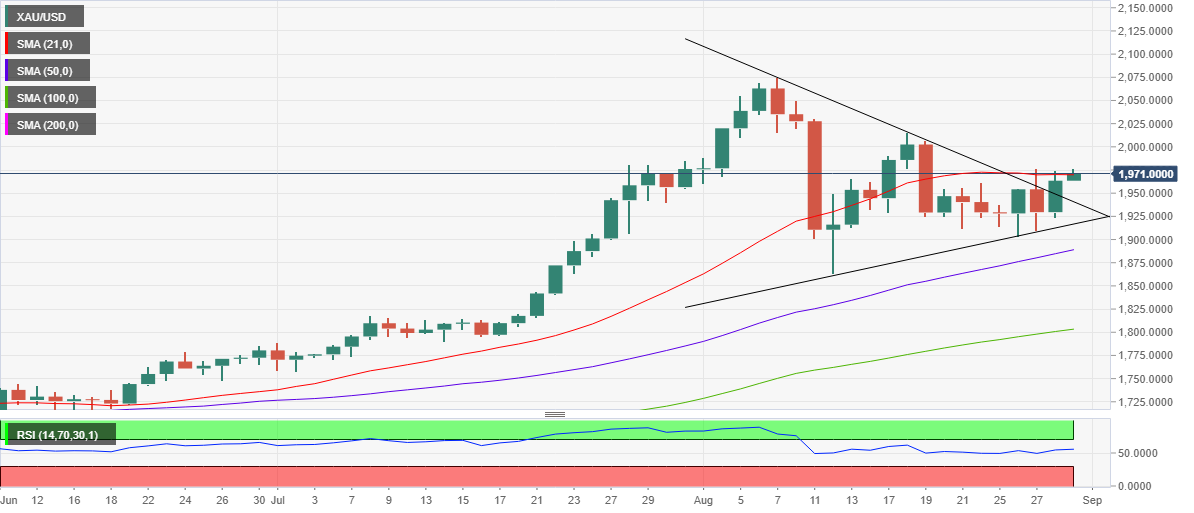
A symmetrical triangle breakout was confirmed on Friday after gold closed the week above falling trendline (pattern) resistance at $1950.
Therefore, the bulls remain in control starting out a fresh week, with the hourly Relative Strength Index (RSI) pointing north above the midline.
Despite the upbeat momentum, the price is struggling to make a decisive move past the horizontal 21-daily Simple Moving Average (DMA), currently at $1970. A daily closing above that level is needed to extend the bullish break towards the July high of $1985. Acceptance above the July high will call for a test of the $2000 mark.
On the flip side, should the price deliver a daily closing below $1950, the abovementioned resistance now turned support, the near-term bullish bias could likely weaken. The next cushion is seen at Friday’s low of $1923.
Gold: Additional levels to consider
XAU/USD
| OVERVIEW | |
|---|---|
| Today last price | 1970.80 |
| Today Daily Change | 7.34 |
| Today Daily Change % | 0.37 |
| Today daily open | 1963.46 |
| TRENDS | |
|---|---|
| Daily SMA20 | 1969.78 |
| Daily SMA50 | 1884.74 |
| Daily SMA100 | 1800.8 |
| Daily SMA200 | 1678.58 |
| LEVELS | |
|---|---|
| Previous Daily High | 1973.96 |
| Previous Daily Low | 1923.25 |
| Previous Weekly High | 1976.79 |
| Previous Weekly Low | 1902.76 |
| Previous Monthly High | 1984.8 |
| Previous Monthly Low | 1757.7 |
| Daily Fibonacci 38.2% | 1954.59 |
| Daily Fibonacci 61.8% | 1942.62 |
| Daily Pivot Point S1 | 1933.15 |
| Daily Pivot Point S2 | 1902.85 |
| Daily Pivot Point S3 | 1882.44 |
| Daily Pivot Point R1 | 1983.86 |
| Daily Pivot Point R2 | 2004.27 |
| Daily Pivot Point R3 | 2034.57 |


Comments
Log in or sign up to join the conversation.