
Gold price is keeping its sluggish momentum intact so far this Friday, wavering a narrow range around $1800. Gold price fails to find a clear directional bias amid mixed clues, as risk-on flows return to markets and lift the Treasury yields, exerting downside pressure on the metal. The Fed’s tapering expectations also push the gold bulls on the sidelines.
Meanwhile, the positive market mood dents the US dollar’s safe-haven appeal, helping keep a floor under the gold price. The downside also remains cushioned, as the underlying theme of concerns over slowing global economic recovery remains intact. Investors remain unnerved about the economic rebound, in light of the spread of the highly contagious Delta covid variant.
Amid a data-light US docket and upbeat market mood, gold is likely to extend its range play. Gold price is set for the third straight weekly gain, with traders now shifting their focus on the next week’s US CPI and Retail Sales data for fresh cues on the Fed’s next policy move.

Image Source: Pexels
Gold Price: Key levels to watch
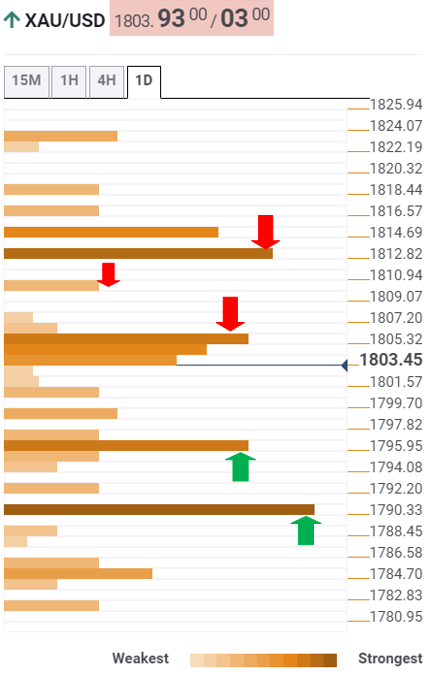
The Technical Confluences Detector shows that gold price is facing stiff resistance at $1807, which is the convergence of the Fibonacci 38.2% one-day, pivot point one-week R1 and the previous high four-hour.
The Fibonacci 61.8% one-day at $1810 will be next on the buyers’ radars.
Any follow-through buying interest would see gold price taking on the powerful barrier at $1813, which is the Bollinger Band four-hour Upper.
The bulls will then yearn to recapture the Fibonacci 38.2% one-month at $1816.
Alternatively, immediate cushion is seen at $1798, the previous low four-hour
Strong support awaits at $1796, which is the intersection of the previous week’s high and SMA5 one-day.
Further south, the last line of defense for gold bulls is aligned at $1791, where the Fibonacci 23.6% one-month and SMA100 one-day coincide.
Here is how it looks on the tool
About Technical Confluences Detector
The TCD (Technical Confluences Detector) is a tool to locate and point out those price levels where there is a congestion of indicators, moving averages, Fibonacci levels, Pivot Points, etc. If you are a short-term trader, you will find entry points for counter-trend strategies and hunt a few points at a time. If you are a medium-to-long-term trader, this tool will allow you to know in advance the price levels where a medium-to-long-term trend may stop and rest, where to unwind positions, or where to increase your position size.


Comments
Log in or sign up to join the conversation.