

XAU/USD rebound from lows near $4,280 has stalled below $4,500.
Lower US yields support Gold's rally, but investors are wary of selling USD ahead of the release of NFP data.
The precious metal faces key resistance at the 200-day SMA, at $4,534.

Gold (XAU/USD) trades flat at the $4,470 area on Friday, as the previous two days’ rebound from $4,280 failed to find acceptance above the $4,500 psychological area. US Treasury yields have pulled back from highs as markets reassess the odds for an interest rate in September, but investors remain wary of selling the US Dollar ahead of the release of US Nonfarm Payrolls (NFP) data, due later on the day.
Analysts at OCBC note that gold “rose more than 2% towards $4,510 intra-session high as Waller’s comments prompted markets to pare September Federal Reserve (Fed) hike expectations, pulling UST yields and the USD lower.”
The bank remains constructive on the pair, although they warn that "near-term direction is likely to stay highly sensitive to Fed repricing,” with NFP data seen as a potential driver of yields and the USD, while “next week’s CPI and PPI should be more decisive in determining whether the recent disinflation trend is sufficient to keep the Fed on hold.”
Technical Analysis: Gold nears key resistance at the 200-day SMA
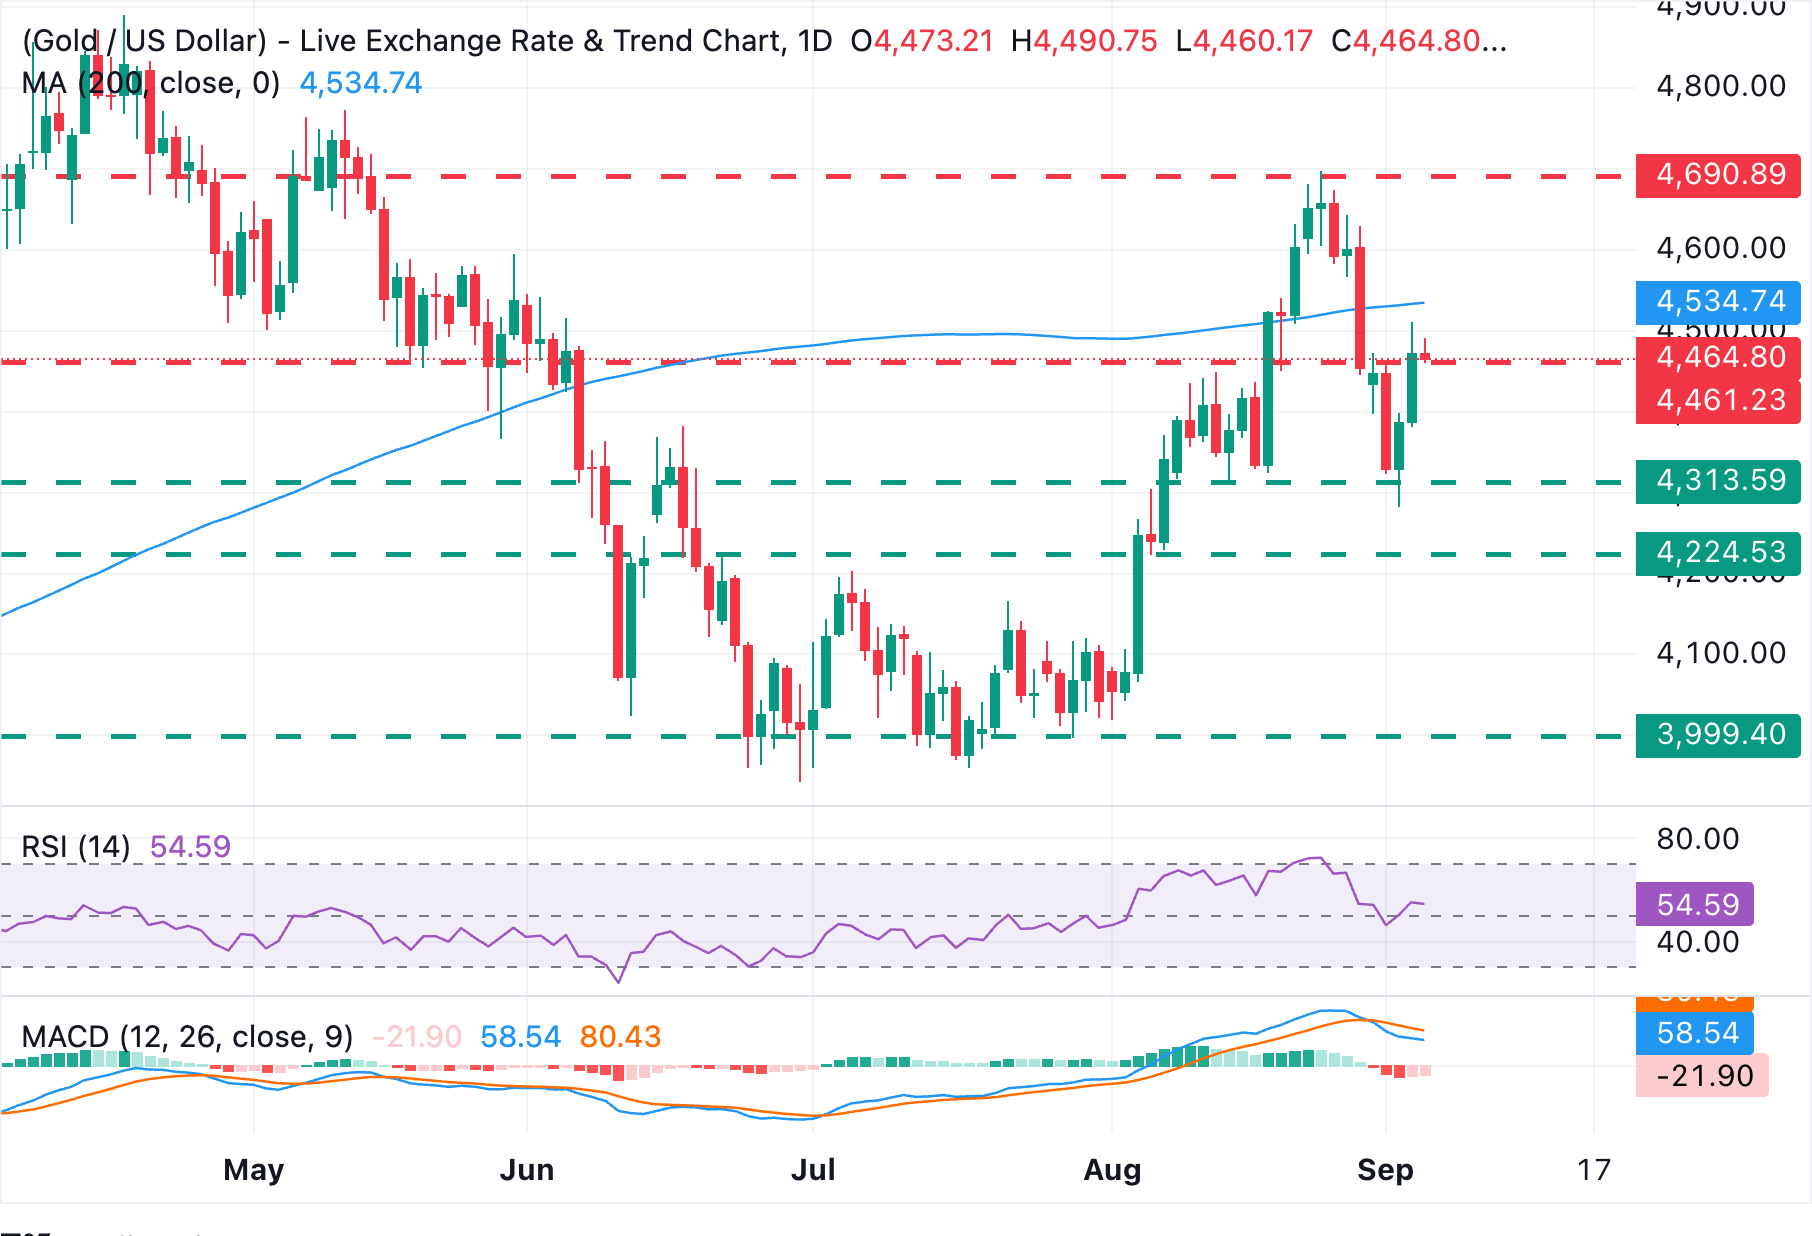
XAU/USD trades at $4,464, still to confirm above a previous support area around $4.470 (August 20 low). Momentum indicators in the daily chart fail to provide a clear view, as the Relative Strength Index (RSI) struggles to take off from the key 50 line, while the Moving Average Convergence Divergence (MACD), still in negative territory, suggests that downside pressure is moderating, rather than fully reversing.
Gold bulls face a string of resistances at the mentioned $4,470 area, the psychological $4,500 level, and especially the 200-day Simple Moving Average (SMA), now at $4,534. This is a very popular indicator for FX traders, and a confirmation above that line would suggest that the correction from $4,690 highs in late August has completed
Bearish attempts, on the other hand, are likely to find support between the August 14 low, at $4,311, and the intra-week low of $4,282. A potential reversal from the 200-day SMA below these levels would confirm a "Head and Shoulders" pattern and add pressure towards the August 6 low of $4,220 and the late July lows near $4,000.



Comments
Log in or sign up to join the conversation.