


Gold (XAU/USD) retreats on Tuesday as US Treasury yields keep their momentum, while energy prices rise further amid a lack of progress in talks between the US and Iran. XAU/USD trades at $4,364, down over 1.10%.
XAU/USD falls as high yields and Oil risks pressure bullion
The US Dollar Index (DXY), which tracks the performance of the buck’s value against a basket of six currencies, is flat at 99.60. The US 10-year Treasury yield has fallen by more than 1 basis point to 4.712%. Worth noting that US Treasury yields hit their highest levels since 2007, earlier in the session, a headwind for Gold, which bears no interest.
A de-escalation of the conflict seems far from happening after US President Donald Trump said that Iran is unlikely to accept Washington's terms to end hostilities. Meanwhile, Iran is adopting an offensive stance, adding that the Strait of Hormuz will remain closed if Washington doesn’t accept their terms.
Oil prices remained underpinned by uncertainty in the Middle East, which favors a Federal Reserve (Fed) interest rate hike. A weaker-than-expected jobs report and inflation data edging lower forced investors to price out rate hikes in 2026.
Data-wise, US Housing Starts in July fell 12.4% MoM, from June’s 1.415 million to 1.239 million, due to higher mortgage rates, which have spiked since the beginning of the Middle East conflict, and elevated home prices. At the same time, the Federal Reserve reported that Industrial Production for July dipped from the expected 0.3% to 0.2% MoM.
Investors are currently awaiting Wednesday's release of the Federal Reserve's policy meeting minutes for insights into the expected path of future interest rates.
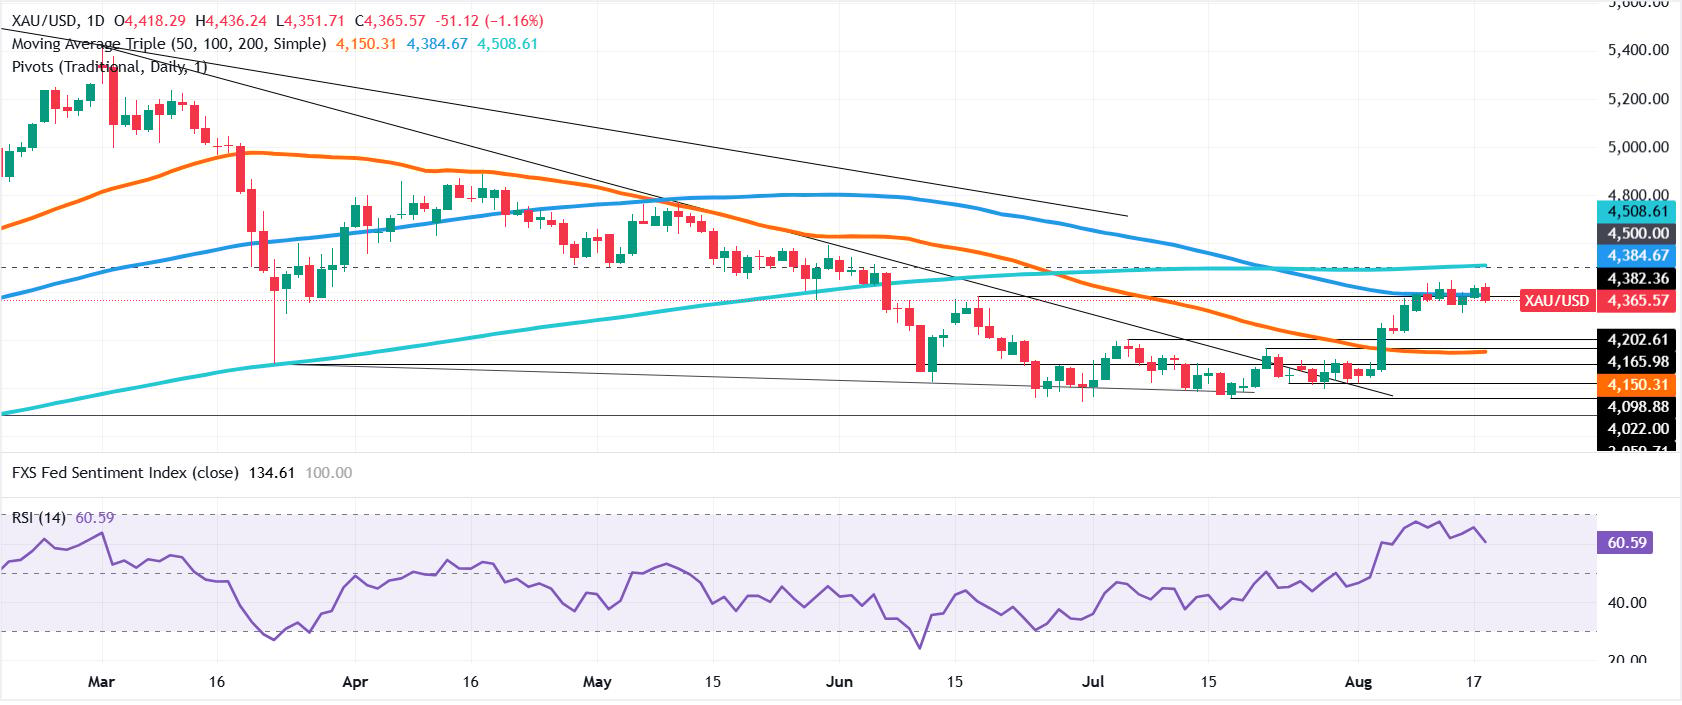
XAU/USD technical analysis: Gold fell below 100-day SMA, eyes on $4,200
Gold prices are once more below the $4,400 mark and fell under the 100-day Simple Moving Average (SMA) of $4,384. Bullish momentum seems to be fading as the Relative Strength Index (RSI) dips lower, an indication that sellers are stepping in.
If XAU/USD dives beneath $4,350, expect a test of $4,300, followed by a drop to the July 6 high at $4,202, followed by the 50-day SMA at $4,146 and $4,100.
For a bullish resumption, the first resistance is the $4,400 mark. Up next lies the $4,450 psychological level, followed by the $4,500 milestone.



Comments
Log in or sign up to join the conversation.