

Gold prices fell as Treasury bond yields continued to recover, with the rate on the benchmark 10-year note hitting a one-month high. The latest leg higher in lending rates followed the April 10 release of minutes from the March FOMC meeting, which traders judged as less dovish than anticipated. That has undermined the appeal of non-interest-bearing assets epitomized by the yellow metal.
Crude oil prices continued to consolidate in a familiar range that has contained momentum for a week. API inventory flow data showing US stockpiles shed 3.1 million barrels last week helped engineer an upswing, but the move ran out of steam in familiar territory just below the $65/bbl figure.
FED BEIGE BOOK, MORGAN STANLEY EARNINGS REPORT ON TAP
Looking ahead, the Fed Beige Book of regional economic conditions and the first-quarter earnings report from Morgan Stanley will feed global growth bets. A worried tone on both fronts reflecting slowing global growth might make for a defensive mood. Oil prices are likely to follow stocks lower in this scenario. EIA inventory data may offer something of a counterbalance if API’s estimate proves telling.
Gold’s immediate response will depend on the relative magnitude of divergent moves in yields and the US Dollar. A supportive drop in rates tends to clash with downward pressure from a stronger Greenback as haven-seeking capital flows flock to the currency’s unrivaled liquidity in risk-off trade.
GOLD TECHNICAL ANALYSIS
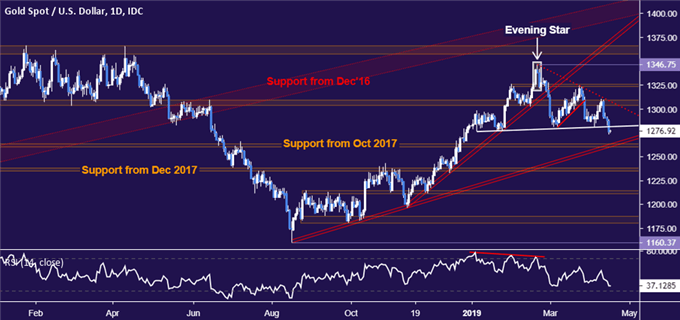
Gold prices finally completed the previously identified choppy Head and Shoulders (H&S) topping pattern. Near-term support is in the 1260.80-63.76 area, but the H&S formation implies a measured downside objective near 1215.00. The pattern’s neckline – now at 1281.31 – has been recast as resistance. A daily close back above that puts the 1303.70-09.12 zone back into focus.
CRUDE OIL TECHNICAL ANALYSIS
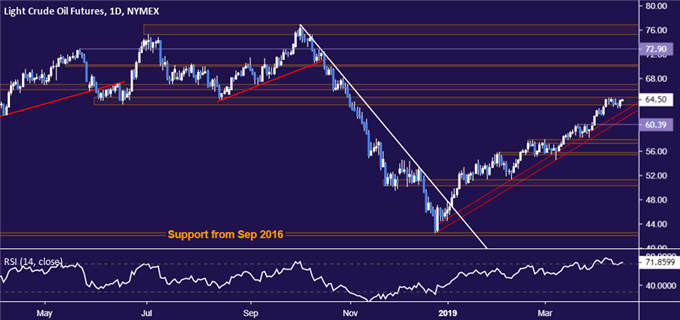
Crude oil prices continue to tread water near support-turned-resistance in the 63.59-64.88 area. A break above this and the 66.09-67.03 inflection zone following immediately thereafter opens the door for a test of the $70/bbl figure. Alternatively, turn below support at 60.39 would invalidate the uptrend from December lows, making for a bearish near-term bias. The first subsequent layer of support is in the 57.24-88 region.



Comments
Log in or sign up to join the conversation.