

GOLD PRICES STABILIZE AS THE US DOLLAR BREAKS OUT TO FRESH YEARLY HIGHS
Perhaps it was a delayed reaction, or maybe the earlier-week breakout in Gold was leading the pack, but as the US Dollar broke-out to the upside yesterday, Gold prices cauterized support from the 2019 lows and have pushed back-up into a prior zone of support. The big question now is how aggressive sellers might remain to be; and whether the April bearish theme in Gold prices remains. And in a related matter, given that strength has shown over the past 24 hours in both USD and Gold – might another round of risk aversion be around-the-corner?
Making matters more interesting from a technical perspective: The descending triangle in Gold prices looked at earlier in the month, which will often be approached in a bearish fashion, has led into a down-side breakout with prices pushed down to fresh lows. But the lows this week are coming in around a bullish trend-line projection as taken from swing-lows in August and October of last year. This puts Gold in an interesting spot, as a hold of support at this longer-term trend-line opens the door for a re-test of shorter-term resistance.
GOLD PRICE DAILY CHART
(Click on image to enlarge)
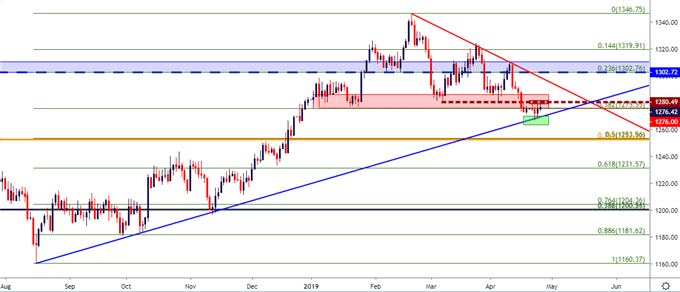
Chart prepared by James Stanley
Going down to a shorter-term look, and there’s still a case to be made for bearish scenarios in Gold prices, and that will remain until price action breaks back above the 1280-level, which was the prior swing-high just ahead of that fresh yearly low. A break above that price opens the door for a continuation of higher-highs and higher-lows, at which point traders can more confidently move-forward with recovery themes.
There is another Fibonacci level at 1286.38, which is the 38.2% retracement of the 2013-2015 major move. If prices do strike above 1280, this becomes a possible area for the next resistance inflection, at which point traders can look to catch higher-low support, plotting from the 1275.55-1280 area on the chart.
GOLD PRICE TWO-HOUR CHART
(Click on image to enlarge)
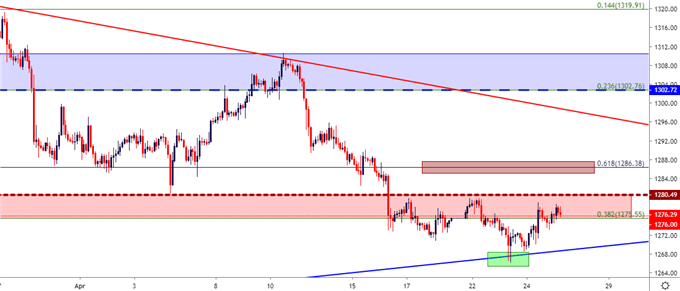
Chart prepared by James Stanley
US DOLLAR BREAKS OUT TO FRESH YEARLY HIGHS
The ascending triangle formation in USD that had been brewing since last year has finally given way to a bullish breakout. This was looked at in the Q2 forecast, as the US currency had spent the better part of the past six months digesting into a narrowing triangle.
Just ahead of yesterday’s bullish breakout, I had looked at a shorter-term ascending triangle formation that had built as price action postured near resistance; and that formation gave way to a very strong bullish push that showed yesterday and has continued to run.
US DOLLAR WEEKLY PRICE CHART
(Click on image to enlarge)
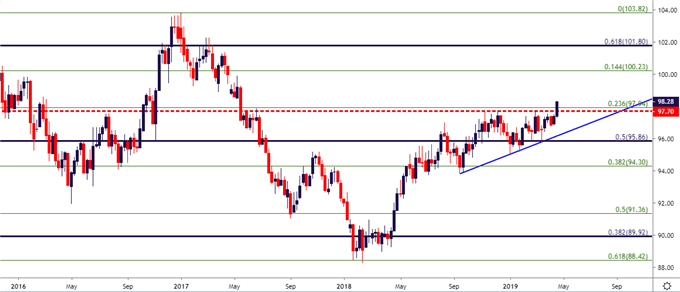
Chart prepared by James Stanley
This topside push in USD has taken-out a number of resistance levels along the way, and the next big obvious spot of resistance potential is around the 100-handle, which is confluent with a couple of different Fibonacci levels. Inside of that, traders would need to reach a bit to find resistance potential, but a prior price action swing-low around the 98.50-level could become of interest, as well as another around 99.25.
US DOLLAR DAILY PRICE CHART
(Click on image to enlarge)
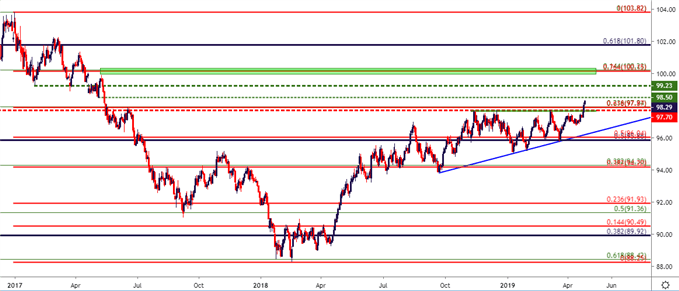
Chart prepared by James Stanley
On the support side of USD, that prior resistance area from the ascending triangle remains as potential higher-low support. But given the continued drive of this bullish run, another area of interest has appeared. This runs between 97.87 and 97.94, with the former of those prices as the 61.8% retracement of the 2017-2018 major move and the latter as the 23.6% retracement of the 2014-2016 major move.
US DOLLAR FOUR-HOUR PRICE CHART
(Click on image to enlarge)
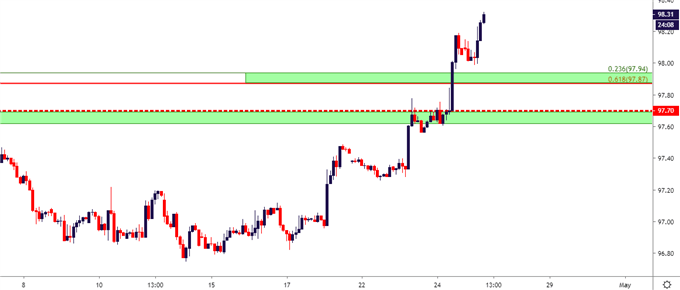
Chart prepared by James Stanley



Comments
Log in or sign up to join the conversation.